50% Strat RetracementThe purpose of this script is to show/alert you when there is a 50% Strat Reversal. It works very well to find possible 3 candles.
The arrows, and line can be turned on and off.
You can change the 50% to say 45% so that you will be alerted before it actually hits the 50% retracement.
The script will only alert if the reversal is a 2up red candle, a 2up green candle which will hopefully turn into a 3 candle.
การวิเคราะห์แท่งเทียน

3LS | 3 Line Strike Strategy [Kintsugi Trading]What is the 3LS | 3 Line Strike Strategy?
Incorporating the 3 Line Strike candlestick pattern into our strategy was inspired by Arty at The Moving Average and the amazing traders at TheTrdFloor .
The Three Line Strike is a trend continuation candlestick pattern consisting of four candles. Depending on their heights and collocation, a bullish or a bearish trend continuation can be predicted.
In a symphony of trend analysis, price action, and volume we can find and place high-probability trades with the 3LS Strategy.
How to use it!
----- First, start by choosing a Stop-Loss Strategy, Stop PIP Size, and Risk/Reward Ratio -----
- Stop-Loss Strategy
Fixed PIP Size – This uses the top/bottom of the indicator candle and places a TP based on the chosen Risk:Reward ratio.
ATR Trail (No set Target Profit, only uses ATR Stop)
ATR Trail-Stop (Has set Target Profit, however, stop is based on ATR inputs)
**If you choose an ATR Stop-Loss Strategy - input the desired ATR period and Multiple you would like the stop to be calculated at**
**ATR Stop-Loss Strategies have a unique alert setup for Auto-Trading. See Auto-Trading Section**
- Risk/Reward Ratio = If you have a .5 risk/reward, it means you are risking $100 to make $50.
- Additional Stop PIP Size = Number of PIPs over the default stop location of the top or bottom of the indicator candle.
----- Next, we set the Session Filter -----
Set the Timezone and Trade Session you desire. If no specific session is desired, simply set the Trade Session to 00:00 - 00:00.
----- Next, we set the Moving Average Cloud Fill -----
Enter the Fast and Slow Moving Average Length used to calculate trend direction:
MA Period Fast
MA Period Slow
These inputs will determine whether the strategy looks for Long or Short positions.
----- Next, we set the VSA – Volume Spread Analysis Settings -----
Check the box to show the indicator at the bottom of the chart if desired.
This is just a different visual output of the VSA | Volume Spread Analysis indicator available for free under the community indicators tab. You can add that indicator to your chart and see the same output in candle format.
In combination with the Moving Average Cloud, the Volume Spread Analysis will help us determine when to take a trade and in what direction.
The strategy is essentially looking for small reversals going against the overall trend and placing a trade once that reversal ends and the price moves back in the direction of the overall trend.
The 3LS Strategy utilizes confirmation between trend, volume, and price action to place high probability trades.
The VSA is completely customizable by:
Moving Average Length
MA-1 Multiplier
MA-2 Multiplier
MA-3 Multiplier
Check out the VSA | Volume Spread Analysis indicator in the community scripts section under the indicators tab to use this awesome resource on other strategies.
----- Next, we have the option to view the automated KT Bull/Bear Signals -----
Check the boxes to show the buy-sell signal on the chart if desired.
----- Next, we set the risk we want to use if Auto Trading the strategy -----
I always suggest using no more than 1-3% of your total account balance per trade. Remember, if you have multiple strategies triggering per day with each using 1%, the total percent at risk will be much larger.
For Example – if you have 10 strategies each risking 1% your total risk is 10% of your account, not 1%! Be mindful to only use 1-3% of your total account balance across all strategies, not just each individual one.
----- Finally, we backtest our ideas -----
After using the 'Strategy Tester' tab on TradingView to thoroughly backtest your predictions you are ready to take it to the next level - Automated Trading!
This was my whole reason for creating the script. If you work a full-time job, live in a time zone that is hard to trade, or just don't have the patience, this will be a game-changer for you as it was for me.
Auto-Trading
When it comes to auto-trading this strategy I have included two options in the script that utilize the alert messages generated by TradingView.
*Note: Please trade on a demo account until you feel comfortable enough to use real money, and then please stick to 1%-2% of your total account value in risk per trade.*
AutoView
PineConnector
**ATR Auto-Trading Alert Setup**
How to create alerts on 3 Line Strike Strategy
For Trailing Stops:
1) Adjust autoview/pineconnector settings
2) Click "add alert"
3) Select "Condition" = Strategy Name
4) Select "Order Fills Only" from the drop-down
3) Remove template message text from "message" box and place the exact text. '{{strategy.order.alert_message}}'
4) Click "create"
For Fixed Pip Stop:
1) Adjust autoview/pineconnector settings
2) Click "add alert"
3) Select "Condition" = Strategy Name
4) Select "alert() function calls only"
5) I like to title my Alert Name the same thing I named it as an Indicator Template to keep track
Good luck with your trading!

Bullish & Bearish EngulfingA simple script to filter out bullish and bearish engulfing candles. Size of candles can be filtered.
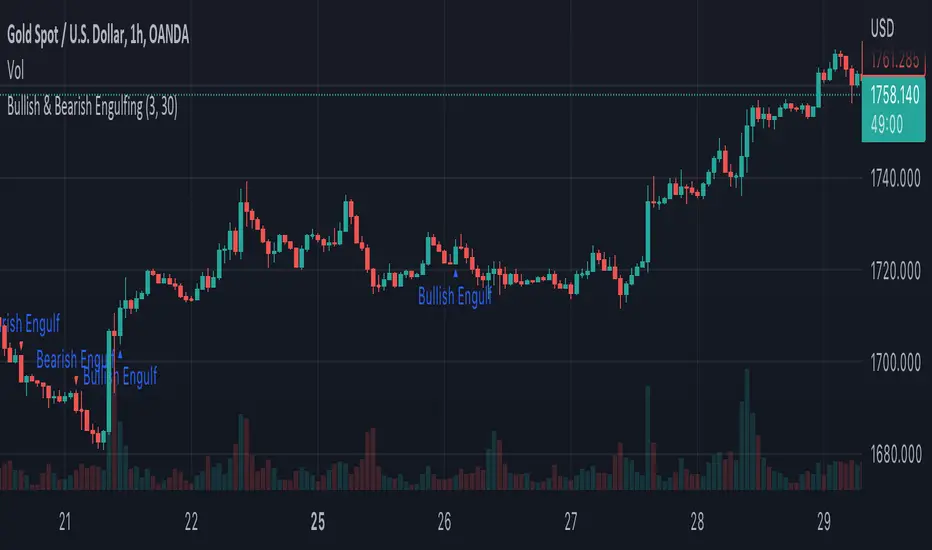
Engulfing Candle Marker (Full Candle)A simple indicator that marks FULL CANDLE engulfing candles...
current high > previous high
current low < previous low
bullish: close > open (triangle below)
bearish: close < open (triangle above)
A lot of the engulfing indicators available are body only. I created a FULL CANDLE indicator because that's what I prefer using.
Can be useful for spotting both reversal and continuation price action. Always have a complete trading plan and backtest it for yourself, engulfing candles in themselves to not guarantee a profit.
You are more powerful than you know...keep expanding!

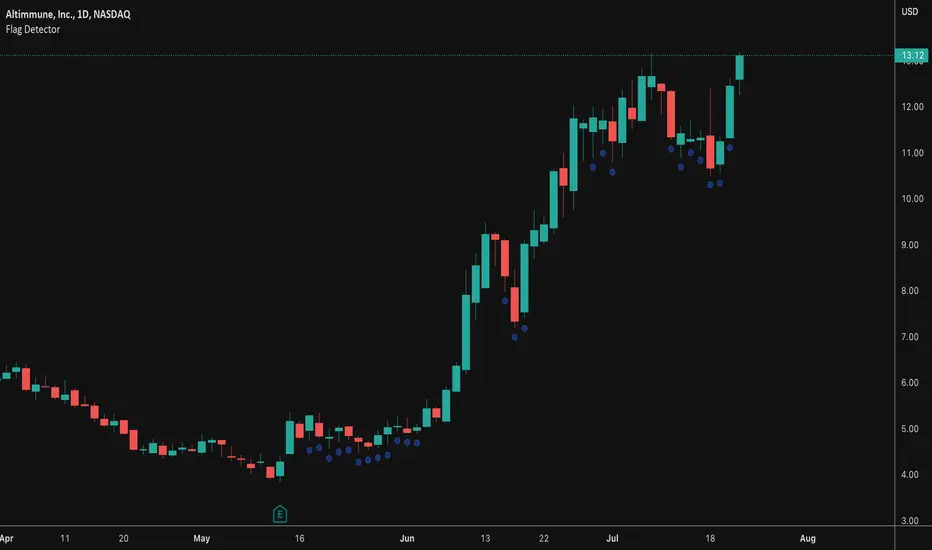
Flag DetectorThis script attempts to find consolidations or retracements within the context of a previous uptrend - basically looking for flag type patterns. It first measures an initial move (referred to as the flag pole in this script) and then looks for consolidation after that move within a certain range. If the consolidation is within the rage, it plots a dot under the candle to show you the consolidation areas. It's not fool proof, but seems to do a decent job of identifying pullbacks and sideways consolidations reasonably well.
Watchlist Screening Hammer & Engulfing Strategies [By MUQWISHI]A trading strategy screener is an idea of a visual alert for those who're trading particular strategies and facing a lack of capability of monitoring many symbols simultaneously, so this kind of tool could be more efficient to keep managing trading plans smoothly and quickly. I developed this screener as an idea more than providing legend strategies.
This screener indicator performs scanning 4 different strategies with customizable 10 symbols inputs, and 5 min is the preferable timeframe.
Strategies
1. Hammer at Low of the day.
2. Shooting Star at High of the day.
3. Bull Engulfing at Low of the day.
4. Bear Engulfing at High of the day.
Screener Overview
Disclaimer
I'm an amateur, and I'm not a qualified licensed investment advisor.
I don't recommend the use of showing signals as a sole means of trading decisions.

3 Line Strike [TTF]This indicator is a spin-off of the popular TMA Overlay indicator made by request of the original author that narrows down the scope to simply identifying a couple of key candlestick patterns - Engulfing candles and 3 Line Strikes.
In addition to being a far more tailored and purpose-specific indicator, we have also update the indicator code to the latest version of Pinescript and added some enhanced alerts.
Candle Stick UpdateHeikin ashi chart so powerful that you can understand trend direction easily. But sometimes, this type of chart doesn't update properly and make no sense on real time. So I made this script. You can now change candle stick style default to heikin ashi (default / modified version) on the real time default chart without switching heikin ashi chart. Enjoy traders!!! And don't forget to press the like button :)

DB Trend Break FinderDB Trend Break Finder
What does the indicator do?
The DB Trend Break Finder indicator is designed to allow for easy visualization of price action trends and works on multiple timeframes (weekly+ recommended). The indicator is faily simple at it's core with background color changes for the following scenarios:
Lower Lows
Lower Highs (Lagging)
Higher Highs
Lower Lows & Higher High Combos (Lagging)
Higher Lows & Lower Highs Combos (Lagging)
How should this indicator be used?
The DB Trend Break Finder indicator should be used for an easy visual reference of the current price action in respect to the previous closing. It can be hopeful for quickly locating price trend changes and possible price action patterns.
Does the indicator include any alerts?
Yes, the script contains alerts for "Lower Low", "Lower High" and "Higher High" conditions. Please note the indicators should be used for alerts to price action changes for manual review and should not be used for robot trading. Some of the plotting is lagging and all of the plots repain in realtime.
Enjoy!

Dante Bullish/Bearish EngulfingBearish and Bullish engulfings as taught by Tom Dante Piccin. Different from other bullish/bearish engulfing indicators because other indicators only want the body of the current candle to engulf the previous body.
This indicator needs the low and high of the current candle to engulf the previous one and also in the example of a bullish engulfing close above the previous candle high or in a bearish engulfing example close below the low of the previous candle.

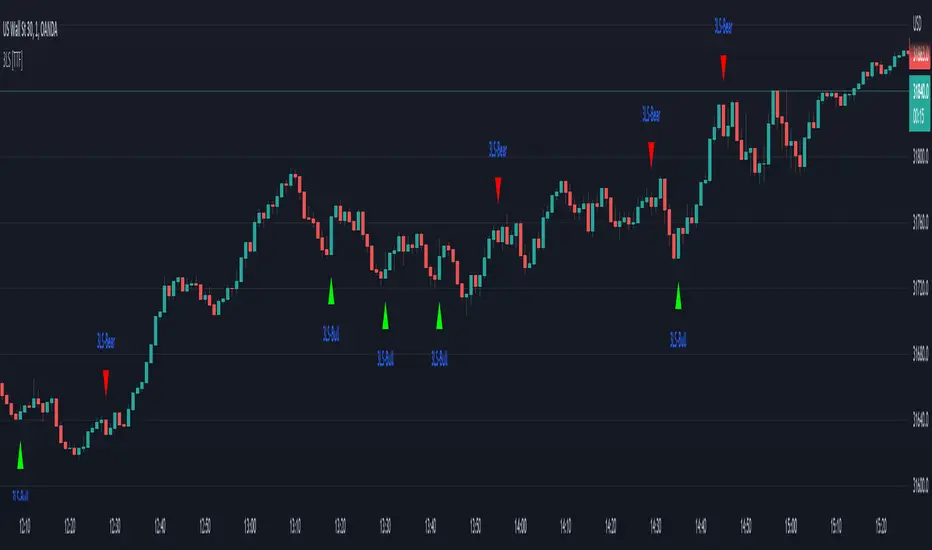
J2S Backtest: 123-Stormer StrategyThis backtest presents the 123-Stormer strategy created by trader Alexandre Wolwacz "Stormer". The strategy is advocates and shared by the trader through his YouTube channel without restrictions.
Note :
This is not an investment recommendation. The purpose of this study is only to share knowledge with the community on tradingview.
What is the purpose of the strategy?
The strategy is to buy the 123-Stormer pattern at the bottom of an uptrend and sell the 123-Stormer pattern at the top of a downtrend, aiming for a short stop for a long profit target.
To which timeframe of a chart is it applicable to?
Recommended for weekly and daily charts, as the signals are more reliable, being that strategy a good option for swing and position trading.
What about risk management and success rate?
The profit target is established by the author as being twice the risk assumed. Also according to the author, the strategy is mathematically positive, reaching around 65% of success rate in tradings.
How are the trends identified in this strategy?
Two averages are plotted to indicate the trend, a fast EMA average with an 8-week close and a slow EMA average with an 80-week close.
Uptrend happens whenever the fast EMA is above the slow EMA and prices are above the fast EMA. In this case, we should start looking for a LONG entry based on the signal of the 123-Stromer pattern to buying.
On the other hand, downtrend happens when the fast EMA is below the slow EMA and prices are below the fast EMA. In this case, we should start looking for a SHORT entry based on the signal of the 123-Stromer pattern to selling.
How to identify the 123-Stormer pattern for a LONG entry?
This pattern consists of three candles. The first candle has a higher low than the second candle's low, and the third candle has a higher low than the second candle's low. In this pattern, we will buy as soon as a trade occurs above the third candle's high, placing a stop as soon as a trade occurs below the second candle's low, with profit target twice the risk assumed. In another words, the amplitude of the prices of the three candles from the third candle’s high upwards. (you can use fibonacci extension to determine your stops and profit targets).
Importantly, the low of the three candles must be above the fast EMA average and in an uptrend.
How to identify the 123-Stormer pattern for a SHORT entry?
This pattern consists of three candles. The first candle has a lower high than the second candle's high, and the third candle has a lower high than the second candle's high. In this pattern, we will sell as soon as a trade occurs below the third candle's low, placing a stop as soon as a trade occurs above the second candle's high, with profit target twice the risk assumed. In other words, the amplitude of prices of the three candles from the third candle’s low down (you can use fibonacci extension to determine your stops and profit targets).
Importantly, the high of the three candles must be below the fast average and in a downtrend.
Tips and tricks
According to the author, the best signal for both LONG or SHORT entry is when the third candle is a inside bar of second candle.
Backtest features
Backtest parameters are fully customizable. The user chooses to validate only LONG or SHORT entries, or both. It is also possible to determine the specific time period for running the backtests, as well as setting a threshold in candels for entry by the 123-Stormer pattern.
Furthermore, for validation purposes, you can choose to activate the best signal of the pattern recommended by the author of the strategy, as well as change the values of the EMA averages or even deactivate them.
Final message
Feel free to provide me with any improvement suggestions for the backtest script. Bear in mind, feel free to use the ideas in my script in your studies.

RSI In-Chart Indicator with Candle StickSimplified RSI with in Chart Indicator for better analysis, What is does? it simply plot OB/OS over candles for better understanding. Also you can on/of candle stick along side in setting but the RSI is always on.
Candle stick Patterns
Three White Soldier (TWS)
Three Black Crows (TBS)

Fake breakHi Traders,
I've developed an indicator which can detect fake-breaks on the chart.
In the following you'll find the definition of the fake break candles and also you will find how to recognize it on the chart with practical examples.
What is the fake break pattern?
Sometimes support and resistance lines broke with a full body and strong candles that gives us the idea of sharp movements on the chart but suddenly the next candle returns all the path of the previous candle. in this case we can say fake break is happening on the chart.
This indicator detect fake break patterns based on two criteria:
1. It uses AverageTrueRange indicator to measure the strength of the pattern.
2. The returning candle should engulf minimum 75% of the break candle.
This indicator plot 2 terms in the name of "FB-D" and "FB-U" that are abbreviations of the "Fake Break Down" and "Fake Break Up".
You can also set alerts to get notified when fake breakout happens on the chart.
Notice: This pattern is only acceptable in valid support and resistance zones and you can not rely on it everywhere on the chart (specially in the middle of the waves).
Notice: The source code of this indicator is open and you are allowed to use it on your scripts by mentioning the name of author.
Disclaimer: This is not a financial advice or any signal to buy or sell, the goal of developing such an indicator is to use for educational purposes.

PopGun Trading, PG Pattern DetectorPopGun Bar Pattern Strategy
PG Trading
The indicator does the following:
It detects the Outside Bar, the smaller inside Bar and the 3rd Pop Gun that is bigger, than the inside Bar.
When the Pop Gun was detected, the indicator will calculate 3 targets for long and short trades.
In our understanding, a Pop Gun is neutral. The next candles after the Pop Gun will decide if the PG breakout is bullish or bearish.
So if one of the next candles after the PG is breaking the high or low of the PG Candle, this is a breakout confirmation and can traded long or short.
We are using the PG Indicator for Stock, Futures and Index Trading.
The Script uses 3 targets per default, but you can extend the target dots up to 6.
If you want to see the targets in plain text, you can activate the PG Box.
The targets are calculated really easy: Just the height of the candle multiplied with 1, 2 and 3 (4,5 and 6 additionally). In some communities there is an ATR calculation for more extended targets but it seems, that the ATR Calculation will sometimes lead to unreachable targets if the ATR is really high intraday...
We trade PopGuns starting at M15 chart. I think PGs smaler than M15 are not worth a trade...
Maybe i will add the ATR Function in the future just to compare the 2 ways to calculate PG targets. We are really doing well with 1,2,3 targets based on the PG Candle size. (Low to High).
Please leave a comment if you have some feature requests or input to make this the best Pop Gun Indicator in Trading View ;-)

Doji FinderModified version of HPotter's "Doji and Near Doji automatic finding script".
Candles are classified based on not just the size of the body but also the distance from the close to the high/low. This avoids classifying a reversal candle with a long wick but a strong close as a doji.

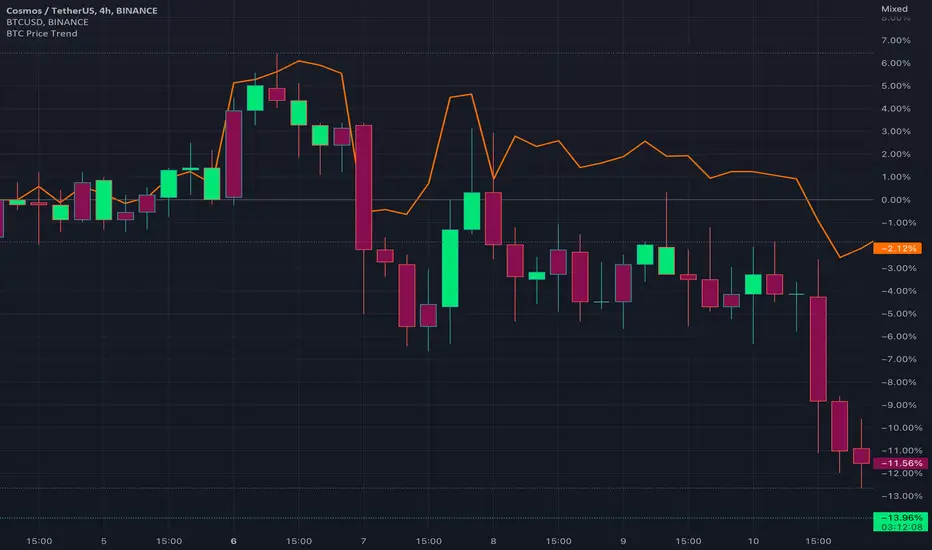
BTC Price TrendThe crypto market is reacting very quickly based on BTC price, thus monitoring the BTC price is very helpful.
This script will color the candles based on the BTC price trend. Set the timeframe and down/up percentage to monitor the BTC price trend, and the script should not repaint.
The indicator will monitor the BTC price in a high frame, for example, for 4 hours, if the price goes down the set percentage during one candle, will change the candle color. Thereafter, if the price goes up within a small timeframe (as you set) then the candle color will be changed.
So, in case the bar color is red, then it is recommended to avoid trading since the BTC price is down trending.
The indicator is requesting the BTC price as of now, and the previous closed price, then it will calculate the price difference, if it result is minus, then the price is in a downtrend, else it is in an uptrend.
Better Heiken-Ashi Candles w/ Expanded Source Types [Loxx]Better Heiken-Ashi Candles w/ Expanded Source Types is an indicator to compare regular candles to traditional Heiken-Ashi candles to "better" Heiken Ashi candles. This indicator and comparison study appears an oscillator. The purpose of this indicator is to demonstrate a better way to calculate HA candles and also to demonstrate expanded source types. This indicator is meant to be used by advanced Pine Coders who wish to add fine-tuning to their indicators and strategies.
What are Heiken Ashi "better" candles?
The "better formula" was proposed in an article/memo by BNP-Paribas (In Warrants & Zertifikate, No. 8, August 2004 (a monthly German magazine published by BNP Paribas, Frankfurt), there is an article by Sebastian Schmidt about further development (smoothing) of Heikin-Ashi chart.)
They proposed to use the following :
(Open+Close)/2+(((Close-Open)/(High-Low))*ABS((Close-Open)/2))
instead of using :
haClose = (O+H+L+C)/4
According to that document the HA representation using their proposed formula is better than the traditional formula.
What are traditional Heiken-Ashi candles?
The Heikin-Ashi technique averages price data to create a Japanese candlestick chart that filters out market noise.
Heikin-Ashi charts, developed by Munehisa Homma in the 1700s, share some characteristics with standard candlestick charts but differ based on the values used to create each candle. Instead of using the open, high, low, and close like standard candlestick charts, the Heikin-Ashi technique uses a modified formula based on two-period averages. This gives the chart a smoother appearance, making it easier to spots trends and reversals, but also obscures gaps and some price data.
What's going on with this indicator?
- First, we have the options to select the candlestick type: Regular, HA, HA Better
- Next, and to demonstrate the expanded source types, I've added a simple moving average. In the drop down for the SMA source you'll notice something very different from the typical TradingView source selector. Here's how to decode the new names for the sources:
Close = close
Open = open
High = high
Low = low
Median = hl2
Typical = hlc3
Weighted = hlcc4
Average = ohlc4
Average Median Body = (open+close)/2
Trend Biased = (see code, too complex to explain here)
Trend Biased (extreme) = (see code, too complex to explain here)
... for HA and HA better, see the same set up as above but with different open and close values to calcualate the other source types
- For the HA better calculations, we run the close value through either an Adaptive, Kaufman, or T3 smoothing filter. The length for these smoothing filters, either 2 or 3, can be found in the code and is a constant value that shouldn't be changed. This smoothing is in inline with what is described in the article mentioned above
- Lastly, I've placed an SMA over the oscillator so that the user can test out the various sources explained above
Included:
- Toggle on/off bar coloring

Neo's Divergence FractalsDivergence Fractals combine divergence candlestick patterns with concepts pioneered by Bill Williams and George Lane to create a precise trend following tool that responds very well to the FX market. This indicator is built off of my Neo Fractal data set, which unlike traditional Williams fractals, track highest and lowest closes instead of higher highs and lower lows. Through my own research, I've found Neo Fractals to be a much more accurate way of pinpointing %K and RSI extremes than Williams fractals, especially in scenarios where markets make higher highs or lower lows, but fail to close higher or lower. This can lead to false divergence signals because the stochastic and RSI values aren't referenced at their highest or lowest point.
If divergence is detected between the previous close and the closest fractal above or below the close, the script then waits for a close above (bullish), or below (bearish) the close where divergence was present, at which point, an up (bullish) or down (bearish) fractal will appear on the chart. Divergence signals followed by engulfing candles are also colored, so they're easy to spot. These are the highest quality reversal or in some cases trend continuation signals! Divergence Fractals can be a great entry tool, but can also be great for managing and closing active trades as well. This indicator was designed to work in tandem with my %K as well as my proprietary Lucky7 indicator, mainly on the 1HR chart.

Master CandleMaster Candle
Definition
A master candle can only exist when 4 consecutive candles after it consolidate within the candle’s range (high and low). Basically, a master candle should engulf the 4 following candles
Common Belief
Literature suggests it be used as a breakout strategy. When a master candle is formed, they assume the 5th,6th or 7th candle are the candidates for a potential breakout.
If the there is no breakout after the 7th candle, the master candle should be disregarded. There are many scenarios where it does work, but just as many when they don’t.
Interpretation
The idea of the master candle does hold some significance, but I see the break of the master candle as a sign of a potential continuation, retracement, or reversal.
The indicator
I have kept the original theory as default (minimum criteria which is MC=C1234+B123) but have allowed the option to edit the parameters.
Another option I’ve added is to allow wicks to breach the Master Candle as long as they open and close within its range. The only time the range is broken (5th candle onwards) is when a candle body closes above or below the master candle range.
Since I did not want to define the break as a breakout, I’ve named it a ‘Swish’. So, it’s either a Swish High or a Swish Low. Traders should make their own judgement on the intended direction based on their own analysis. A retracement entry into the intended direction is all I can advise.
Examples:

Wick Pressure/Close point inside the barCalculates the strength of closing within the bar. Higher the closing within the high/low points of the bar, greater is the buying strength and vice versa. HMA of the score for the input period is then divided by standard deviation for smoothing. Works well for higher timeframes with a larger data set. Compliments other indicators. Input period should be changed for various timeframes. Shorter the timeframe, the longer the input period is preferable.

Pinbar trailing stop strategyThe strategy finds the nearest pinbar pattern and opens a position (long or short). You choose your take profit and stop loss multiplier.
Take Profit - X times the pinbar size from it's highest point.
Stop loss - X times the pinbar size from it's lowest point.
You can find more detailed screenshots and the source-code on my github page: samgozman/pinbar-strategy-tradingview

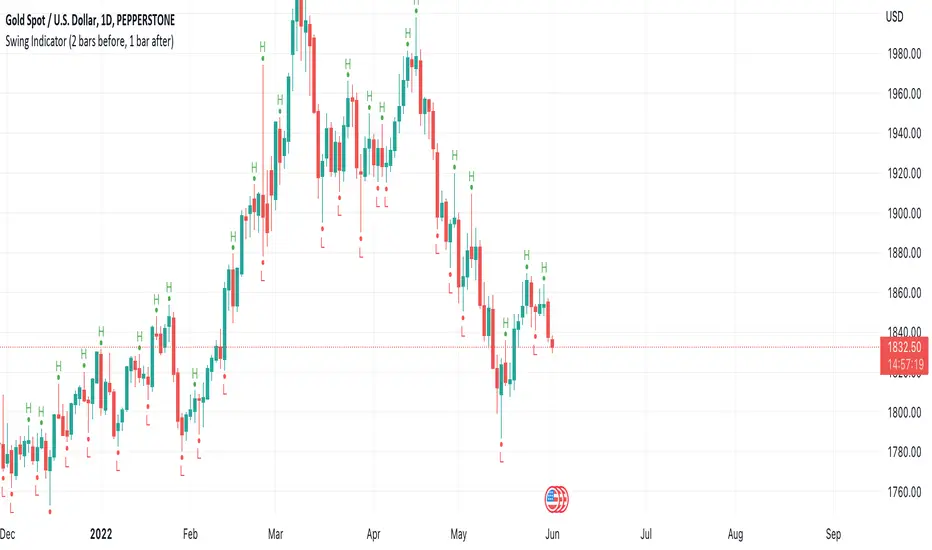
Swing Indicator (2 bars before, 1 bar after)This swing indicator is created to mark swing high and low followed by the condition of Bravo Trade Academy.
Conditions for being a Swing High
- The high price of swing high bar has to be higher than the high price of 2 bars before and 1 bar after
Conditions for being a Swing Low
- The low price of swing low bar has to be lower than the low price of 2 bars before and 1 bar after
=========================================================================
Swing Indicator นี้สร้างขึ้นเพื่อช่วยในการมาร์ค Swing High และ Swing Low ตามเงื่อนไขการเป็น Swing หน้า 2 หลัง 1 ของ Bravo Trade Academy
เงื่อนไขการเป็น Swing High
- ราคา High ของแท่งที่เป็น Swing High จะต้องสูงกว่าราคา High ของแท่งก่อนหน้า 2 แท่ง และแท่งหลัง 1 แท่ง
เงื่อนไขการเป็น Swing Low
- ราคา Low ของแท่งที่เป็น Swing Low จะต้องต่ำกว่าราคา Low ของแท่งก่อนหน้า 2 แท่ง และแท่งหลัง 1 แท่ง
Liquidity Heatmap LTF [LuxAlgo]This indicator displays column heatmaps highlighting candle bodies with the highest associated volume from a lower user selected timeframe.
Settings
LTF Timeframe: Lower timeframe used to retrieve the closing/opening price and volume data. Must be lower than the current chart timeframe.
Other settings control the style of the displayed graphical elements.
Usage
It can be of interest to show which candles from a lower timeframe had the highest associated volume, this allows for the highlighting of areas where a candle body was the most traded by market participants.
The area with the highest activity is highlighted in the script with a yellow color (or another user selected color) and additionally by two lines forming an interval.
When the candle body with the highest volume is overlapped by a candle body with lower volume this one will be highlighted instead, hence why certain areas of high activity might not be highlighted by the heatmap.
It is recommended to hide regular candles or use a more discrete graphical presentation of prices when using this tool. Lines are also displayed to highlight the full candle range as well as if a candle was bullish (in green) or bearish (in red). These lines can be hidden if the user is only interested in the heatmap.
