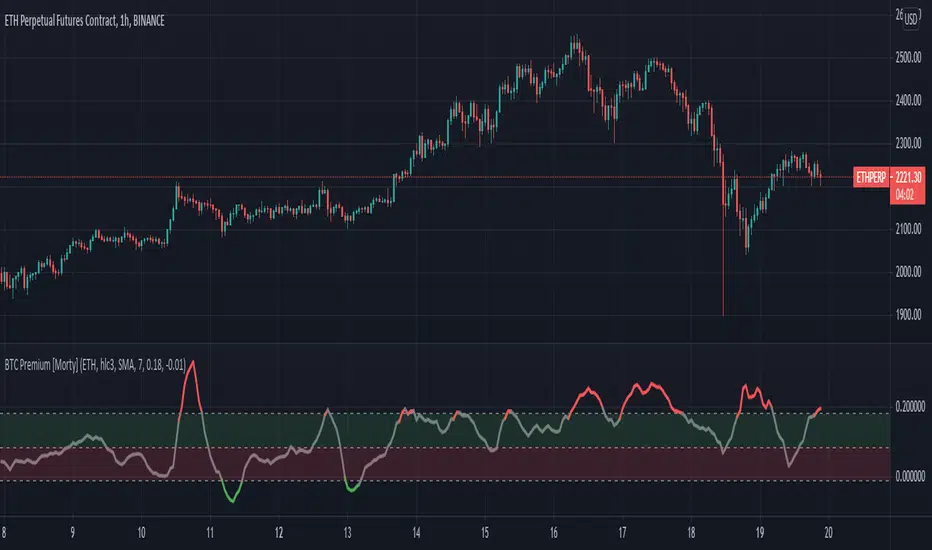
Trend Reversal Indicator (EMA of slopes)Good morning Traders
Inspirated by lukescream EMA-slope strategy, today I want to share with you this simple indicator whose possible use-case would be for detecting in advance possible trend reversals, specially on higher timeframes.
Once that you've chosen the desired source (RSI, EMA or Stochastic k or d), the indicator will calculate its "slope" approximating its first order derivative by the division between the last variation of the series and its last value.
You can see the slope as a white line by enabling the relative checkmark (it's disabled by default since it simply messes up the the graph)
Then, the slope itself becomes the source for two exponential moving averages: the fast one (in blue) has a period of 20 while the slow one (in red, it becomes similiar to a horizontal line actually) has a period of 500
Why the slope? Since all the sources mentioned before are directly or indirectly calculated on the price action, a more aggressiveness in the price movement would be translated into a more (positive/negative) steepness of those indicator (of course this effect would be far more evident if the indicators are calculated on low periods, but really low periods could compromise the consistency of the signals).
In this way, the slope would mirror the decisiveness of price movements and a comparison between two averages calculated from it (the first one based on more recent values, the second one that conisders also older values) could tell you in advance what direction the market is possibly about to take
The usage is simple: once that the fast moving average crosses upward the slow one, this could be a sign of potential trend reversal from bearish to bullish. On the contrary, if the fast EMA crosses downward the slow one, this could be a sign of potential trend reversal from bullish to bearish.
What I suggest you is to integrate this indicator with Exponential Moving Averages plotted on the price candles, in order to have a general bias for opening long or short positions, and with an oscillator as well such as the Stochastisc RSI in order to detect the overbought/oversold zones for opening/closing positions at the right moment.
Happy Trading!
บิทคอยน์
FTX vs BitMex BTC Perp PremiumThis script compares FTX BTC/PERP (BTC perpetual futures contract) price to Binance BTC/USDT spot and colors it red. It also plots Bitmex's BTC perpetual futures compared to Binance spot and colors it blue.
FTX = red
Bitmex = blue
Now you can easily see that you can get a 1% discount on FTX perpetuals when it is tanking. This tells you that you can set your limit buy orders extra low if you like to catch crashes. Also, you can see what your average trader on each platform is willing to pay above or below the spot premium. In general you want to do the opposite of what the average trading is doing on these exchanges unless you're in the main bull or mania phase of the Bitcoin cycle.
If you want to use Bitstamp or your favorite exchange it can be changed in the settings. Let me know if you find any settings that work well for you.
May you profit and enjoy! :)
Weighted derivatives premium BTCCan be extended with more derivative or spot pairs, see the comments in the code for instructions. Most importantly, the pairs need to be added to the respective arrays in the same order, so that the weights are applied to the correct pairs.
BTC Longs & Shorts Profile WHAT DOES THIS INDICATOR DO?
I started with the idea of creating another premium indicator with a bunch of features and add it to the bundle. However, the more complex the code was becoming, the less helpful the indicator actually was. So I started from scratch and made BTC Longs & Shorts Profile super simple (as you can see in the code).
The advantage over other similar indicators is that this one has a drop-down menu and allows you to select whether you want to see Longs, Shorts, Ratio, or Difference. Having Longs and Shorts at the same time is a bit confusing because Longs pretty much dwarf the Shorts and the ups and downs are not clearly visible. Also, you can configure the colors for each visible line.
My suggestion is to add this indicator to your BTC chart, save it as a template from the top menu on TradingView and stop switching between BTC, Bitfinex Longs and Shorts. You have everything in one simple window (that's especially the case if you are not a pro or premium member and can't have more than 2 screens simultaneously).
ANYTHING ELSE ?
On a side note, if you are planning on working on a similar indicator, let me tell you what I've tried so far and it didn't work for me:
- RSI calculations including Longs and Shorts as a base
- Longs and Shorts in relation to BTC itself and a relationship with the volume
- Directional Movement Index, where Longs are DM+ and Shorts are DM-
- Smoothing both Longs and Shorts and trying to find a relationship (including some pseudo MACD lookalikes)
Anyway, if you have any ideas or suggestions on improving this indicator, please let me know. Thanks!
BITCOIN CME FUTURES GAPSDisplays information about Bitcoin CME Futures Gaps over BTCUSD (or XBTUSD) charts.
You can configure a threshold percentage to only display gaps whose size is greater than that percentage. The gap precentage is calculated based on the current close price.
Gaps up are displayed in Orange, gaps down in Green
200 Week Moving Average HeatmapСolors part of the SMA depending on the change in % (delta %) to the previous value. From blue(none to low increase) through green(moderate increase) to red(high increase).
Bitcoin Estimated Transaction FeeThis is the estimated fee you can expect to pay to have your bitcoin transaction confirm in 1 block. The estimation is derived from the daily total revenue miners received divided by the daily total number of transactions.
An option to change to a different currency is provided.
Notes on transaction fees:
Most exchanges do not provide an option to change the fee amount, and charge a static fee. A notable exception is Deribit.
The newer Bech32 wallet format, also known as native or SegWit, use a lower fee for the same transaction as legacy addresses. The addresses start with "bc1".
Mania was $60 USD to move bitcoin to an exchange you've only just heard of to buy a different coin with funny name :)
CRYPTO Trend Direction Multiple EMA'sToday I bring an indicator specialized in crypto markets.
Its made of multiples EMA : very fast, fast, normal, slow, very slow
The logic behind its simple :
For long : we check that the EMA are in ascending order like EMA 5 > EMA 10 > EMA 20 .... and at the same time that last close of candle is above all of them.
For short : we check that the EMA are in descending order like EMA 5 < EMA 10 < EMA 20 .... and at the same time last close of candle is below all of them.
It can be used with all time frames.
Enjoy it !
OnTheMoveWith this plot one is able to compare the different % change in the given time frame. It calculates the sma of a given period (defval = 7) for the close/open.
Strategy would be to choose (trade) from one to other asset in order to get higher rates when pumping or lower when dumping.
The Symbol & exchange has to be specified.
defSymbols = BTC, ETH and LINK
defExchange = BINANCE
GBTC Fomo Panic PremiumIt is rumored that GBTC price action leads the Bitcoin market. This indicator compares GBTC fomo/panic levels to the (Binance) BTC spot market. Fomo is measured as large percentage moves of the high price from the min over a look-back period. Panic is measured as large percentage moves of the low price from the max over a look-back period. A prime example of this indicator's usage would be as a sell signal confirmation during the 2020 pre-Thanksgiving panic exhibited on the 1-hour chart while the 20 EMA was still above the 99 SMA.
You can customize the leading and lagging markets and the length of the lookback period. I would love to hear what parameters, markets and timeframes work for you. Maybe there is a way to leave comments, or hit me up on Twitter: @thirdreplicator
May you profit and enjoy.
[5F ] Number of Bitcoin wallets-═════════════════════════-
This is a simple script that displays the total number of Bitcoins wallets based on the data provided by Quandl.
Use it in dayli resolution minimum
Refresh every day
Thanks to all Pinecoders who share their work with the community.
-═════════════════════════-
MA+ADX+DMICOINBASE:BTCUSD
BINANCE:BTCUSDT
Use long and short moving average to look for a potential price in/out. (default as 14 and 7, bases on the history experience)
ADX and DMI to prevent the small volatility and tangling MA.
Test it in 4HR, "BINANCE:BTCUSDT"
From 12/1/2017- 11/1/2020 (Mixed Bull/Bear market)
Overall Profit: 560.89%
From 1/1/2018 - 1/1/2019 (Bear market)
Overall Profit: -2.19%
From 4/1/2020 - 11/1/2020 (Bull Market)
Overall Profit: 274.74%
Any suggestion is welcome to discuss.
Perp vs Spot Delta (Bybit-CB)Simple script showing the delta of Bybit BTCUSD perp vs Coinbase BTCUSD spot. Orange positive candles show bybit is higher, blue negative candles show Coinbase is higher.
Aggregate BTC VolumeSimple script that shows the aggregate volume of BTC, taking volume data from top spot and derivative exchanges.
BTC & ETH Alert SystemWith Tradingview's free plan, only one alert is allowed. The purpose of this indicator is to allow for two alerts--one for BTC and one for ETH.
How to use the alert system:
1. Set the desired value for BTC and ETH that you want to be alerted for
2. Set an alert on the indicator by clicking the three ellipses and then "Add Alert"
3. Set the alert to go off if the value of the indicator is greater than 0.
The example is of BTC using an alert of $10,000 and an alert of ETH at $2,000 (untriggered)
The script can be easily modified to be used for different assets
Bitcoin DAA OscillatorAn oscillator of Bitcoin's Daily Active Addresses (DAA) and fundamental metric of the utilization of the Bitcoin network.
Helps to identify:
Potential buy zones (green) - when the network utilization is low & increasing
Potential sell zones (red) - when the network utilization is high & decreasing
Risk Metrics: Crypto VersionRisk Metrics for Crypto.
Market can be set to BTCUSD, BTCEUR, BTCCHF, BTCGBP, BTC1!, BTC2!, SPX, and DTB3
Beta
Correlation
Standard Deviation
Variance
R-squared
BITCOIN Miners Revenue VS Price Correlation OscillatorUse 3D(3-day candle) as timeframe for best reading.
------
original template for Correlation indicator was created by obaranova. credit goes to her.
FundCandlesV1sloth288FundCandlesV1sloth288 is an indicator I decided to put together so I can track how funds are doing on $GVT Genesis Vision.
Using a standard MACD or RSI indicator you can change source to use the FundsCandles values to determine if its a good time to enter or exit different funds on the platform.
What you need to know...
Currently all securities need to pair the same, (USD / BTC ).
Security 01, 02, 03 etc etc to maximum of 10 need to be in "BINANCE:LINKUSD" format.
Manually need to input circulating supply from CMC to get the proper ratios for index.
Allocation is the % of the funds exposure to said security.
Inputting the values does not track previous reallocation's, the whole chart will be if the history of the fund was using up to date settings.
Values on the right is the Marketcap of the fund.
Standard settings is of Oracle Basket on the platform made by Somnium Funds as of Aug 13 2020.
Next update will be after GV includes traditional stocks onto the platform for managers to diversify their current allocations into them.
Bitcoin Bull CyclesA simple indicator that identifies the primary upswing of Bitcoin following each Halving, the "Bull Cycle".
A "Bull Cycle" is identified as the first period of positive momentum after each Halving date, defined as the 50 Daily Moving Average (DMA) being above the 200 DMA.