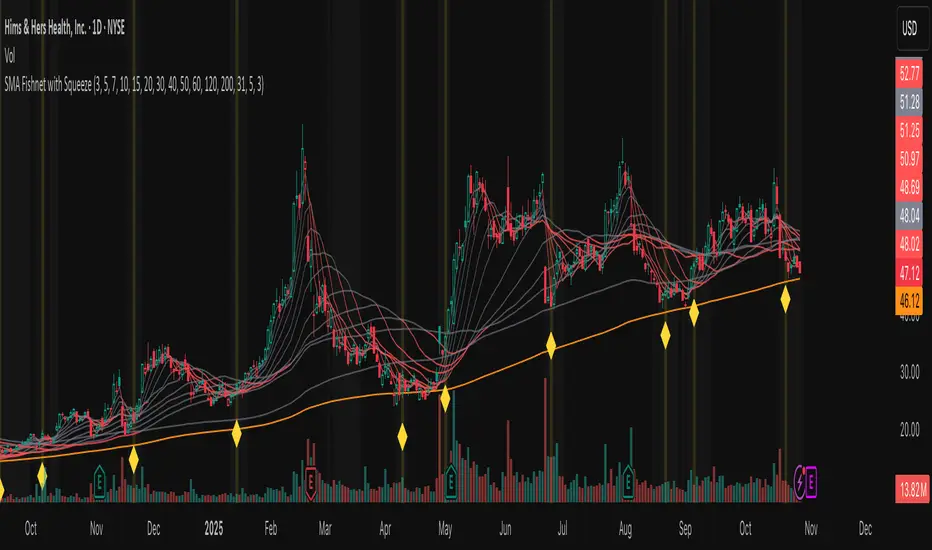
Fishnet Squeeze [Osprey]🟠 Overview
The SMA Fishnet with Squeeze indicator combines a multi-timeframe moving average ribbon system with an advanced squeeze detection algorithm to help traders identify both trend direction and potential breakout opportunities.
🟠 How to Use This Indicator
- Squeeze Breakout Trading
When the indicator signals a squeeze (yellow diamond marker and highlighted background), prepare for a potential breakout in either direction
- Support and Resistance Identification
The twelve SMA levels act as dynamic support and resistance zones. Price often bounces or pauses at these levels, especially at the convergence of multiple SMAs.
Squeeze Settings
- **Enable/Disable**: Toggle squeeze detection on or off
- **Lookback Period**: Adjust the historical comparison window (20-200 bars)
- **Percentile Threshold**: Set sensitivity for squeeze detection (1-20%)
- **Minimum Duration**: Define how many bars must confirm a squeeze (1-10)
- **Visual Customization**: Modify squeeze marker colors to suit your preferences
‼️ Test different values for Lookback Period ! Lower lookback period = more frequent squeeze marks. I suggest using 31 or 100.
🟠 The Fishnet Structure
The indicator employs twelve SMAs ranging from ultra-short-term (3-period) to long-term (200-period), creating a "fishnet" pattern on your chart. This graduated approach provides a comprehensive view of price action across multiple timeframes simultaneously:
🟠 Advanced Squeeze Detection Algorithm
The squeeze detection component identifies periods when all twelve SMAs converge into an unusually tight range, indicating market indecision and potential energy buildup. The algorithm uses several sophisticated filters:
1. ATR-Normalized Range Calculation: The indicator normalizes the SMA range using Average True Range (ATR) to ensure consistent squeeze detection across different volatility environments and price levels.
2. Historical Percentile Analysis: Compares the current normalized range against a customizable lookback period (default: 31 bars) to identify when SMAs are in the bottom percentile of historical tightness.
3. Statistical Validation: Uses z-score analysis to confirm that the current range is significantly below the mean, filtering out false signals.
4. Duration Confirmation: Requires the squeeze condition to persist for a minimum number of consecutive bars (default: 3) to validate genuine compression.
5. Local Minimum Verification: Confirms that the current squeeze represents the tightest point in recent history (20-bar window).
แบนด์และแชนแนล
ICT SMART MONEY__Advanced Multi-Timeframe Target TREND indicator with comprehensive ICT (Inner Circle Trader) concepts, session analysis, and smart money concepts for professional forex and crypto trading.__
---
### __🔥 Core Features:__
#### __📈 Multi-Timeframe Analysis__
- __7 Timeframe Table__: 1min, 5min, 15min, 30min, 1hour, 4hour, Daily analysis
- __Target System__: Stop Loss, Entry, TP1, TP2, TP3 calculations for each timeframe
- __Trend Direction__: Visual arrows showing bullish/bearish bias across all timeframes
#### __⚡ ICT Killzone Sessions__
- __4 Major Sessions__: Asia KZ, London KZ, NY AM, NY PM with colored session boxes
- __Pivot Lines__: Automatic high/low detection with full format labels ("ASIA High", "LONDON Low")
- __Global Label Alignment__: All session labels perfectly aligned for professional appearance
- __Range Analytics__: Real-time pip calculations with historical averages and Turkish volatility analysis
#### __🌍 Trading Session Management__
- __Individual Controls__: Asia/London sessions auto-enabled, NY sessions optional
- __Horizontal Lines__: Clean session high/low tracking without clutter
- __NY Lunch Session__: Additional 11:30-13:30 session for advanced analysis
- __Session Transparency__: Adjustable transparency levels for optimal chart visibility
#### __📍 Professional Key Levels__
- __Monday High/Low__: Weekly opening reference levels
- __Previous Day High/Low__: Daily support/resistance zones
- __Previous Week High/Low__: Major weekly levels
- __Full Format Labels__: "Previous Day High" instead of "PDH" for crystal clarity
- __160 Bar Distance__: Optimized label positioning for clean charts
#### __🔗 Liquidity Trendlines__
- __Automatic Detection__: 8-bar lookback pivot detection system
- __Breakout Signals__: Visual alerts when trendlines are broken
- __Dynamic Padding__: 4.0 ATR-based trendline spacing
- __Bullish/Bearish Colors__: Clear color coding for trend direction
#### __💎 Smart Money Concepts (SMC)__
- __Fair Value Gaps (FVG)__: Automatic gap detection with mitigation tracking
- __Structure Analysis__: BOS (Break of Structure) and CHoCH (Change of Character) detection
- __Structure Fibonacci__: 5-level fibonacci retracements (78.6%, 70.5%, 61.8%, 50%, 38.2%)
- __Lifecycle Management__: Complete FVG and structure history tracking
#### __📊 Range Analytics Table__
- __Session Volatility__: Current pip movement vs historical averages
- __Turkish Analysis__: "Güçlü Momentum", "Yüksek Aktivite", "Normal Aktivite", "Düşük Hareket", "Zayıf Session"
- __Integrated Display__: Seamlessly positioned below multi-timeframe table
- __Professional Formatting__: Color-coded session identification with status analysis

Quantum Market Harmonics [QMH]# Quantum Market Harmonics - TradingView Script Description
## 📊 OVERVIEW
Quantum Market Harmonics (QMH) is a comprehensive multi-dimensional trading indicator that combines four independent analytical frameworks to generate high-probability trading signals with quantifiable confidence scores. Unlike simple indicator combinations that display multiple tools side-by-side, QMH synthesizes temporal analysis, inter-market correlations, behavioral psychology, and statistical probabilities into a unified confidence scoring system that requires agreement across all dimensions before generating a confirmed signal.
---
## 🎯 WHAT MAKES THIS SCRIPT ORIGINAL
### The Core Innovation: Weighted Confidence Scoring
Most indicators provide binary signals (buy/sell) or display multiple indicators separately, leaving traders to interpret conflicting information. QMH's originality lies in its weighted confidence scoring system that:
1. **Combines Four Independent Methods** - Each framework (described below) operates independently and contributes points to an overall confidence score
2. **Requires Multi-Dimensional Agreement** - Signals only fire when multiple frameworks align, dramatically reducing false positives
3. **Quantifies Signal Strength** - Every signal includes a numerical confidence rating (0-100%), allowing traders to filter by quality
4. **Adapts to Market Conditions** - Different market regimes activate different component combinations
### Why This Combination is Useful
Traditional approaches suffer from:
- **Single-dimension bias**: RSI shows oversold, but trend is still down
- **Conflicting signals**: MACD says buy, but volume is weak
- **No prioritization**: All signals treated equally regardless of strength
QMH solves these problems by requiring multiple independent confirmations and weighting each component's contribution to the final signal. This multi-dimensional approach mirrors how professional traders analyze markets - not relying on one indicator, but waiting for multiple pieces of evidence to align.
---
## 🔬 THE FOUR ANALYTICAL FRAMEWORKS
### 1. Temporal Fractal Resonance (TFR)
**What It Does:**
Analyzes trend alignment across four different timeframes simultaneously (15-minute, 1-hour, 4-hour, and daily) to identify periods of multi-timeframe synchronization.
**How It Works:**
- Uses `request.security()` with `lookahead=barmerge.lookahead_off` to retrieve confirmed price data from each timeframe
- Calculates "fractal strength" for each timeframe using this formula:
```
Fractal Strength = (Rate of Change / Standard Deviation) × 100
```
This creates a momentum-to-volatility ratio that measures trend strength relative to noise
- Computes a Resonance Index when all four timeframes show the same directional bias
- The index averages the absolute strength values when all timeframes align
**Why This Method:**
Fractal Market Hypothesis suggests that price patterns repeat across different time scales. When trends align from short-term (15m) to long-term (Daily), the probability of trend continuation increases substantially. The momentum/volatility ratio filters out low-conviction moves where volatility dominates direction.
**Contribution to Confidence Score:**
- TFR Bullish = +25 points
- TFR Bearish = +25 points (to bearish confidence)
- No alignment = 0 points
---
### 2. Cross-Asset Quantum Entanglement (CAQE)
**What It Does:**
Analyzes correlation patterns between the current asset and three reference markets (Bitcoin, US Dollar Index, and Volatility Index) to identify both normal correlation behavior and anomalous breakdowns that often precede significant moves.
**How It Works:**
- Retrieves price data from BTC (BINANCE:BTCUSDT), DXY (TVC:DXY), and VIX (TVC:VIX) using confirmed bars
- Calculates Pearson correlation coefficient between the main asset and each reference:
```
Correlation = Covariance(X,Y) / (StdDev(X) × StdDev(Y))
```
- Computes an Intermarket Pressure Index by weighting each reference asset's momentum by its correlation strength:
```
Pressure = (Corr₁ × ROC₁ + Corr₂ × ROC₂ + Corr₃ × ROC₃) / 3
```
- Detects "correlation breakdowns" when average correlation drops below 0.3
**Why This Method:**
Markets don't operate in isolation. Inter-market analysis (developed by John Murphy) recognizes that:
- Crypto assets often correlate with Bitcoin
- Risk assets inversely correlate with VIX (fear gauge)
- Dollar strength affects commodity and crypto prices
When these normal correlations break down, it signals potential regime changes. The term "quantum" reflects the interconnected nature of these relationships - like quantum entanglement where distant particles influence each other.
**Contribution to Confidence Score:**
- CAQE Bullish (positive pressure, stable correlations) = +25 points
- CAQE Bearish (negative pressure, stable correlations) = +25 points (to bearish)
- Correlation breakdown = Warning marker (potential reversal zone)
---
### 3. Adaptive Market Psychology Matrix (AMPM)
**What It Does:**
Classifies the current market emotional state into six distinct categories by analyzing the interaction between momentum (RSI), volume behavior, and volatility acceleration (ATR change).
**How It Works:**
The system evaluates three metrics:
1. **RSI (14-period)**: Measures overbought/oversold conditions
2. **Volume Analysis**: Compares current volume to 20-period average
3. **ATR Rate of Change**: Detects volatility acceleration
Based on these inputs, the market is classified into:
- **Euphoria**: RSI > 80, volume spike present, volatility rising (extreme bullish emotion)
- **Greed**: RSI > 70, normal volume (moderate bullish emotion)
- **Neutral**: RSI 40-60, declining volatility (balanced state)
- **Fear**: RSI 40-60, low volatility (uncertainty without panic)
- **Panic**: RSI < 30, volume spike present, volatility rising (extreme bearish emotion)
- **Despair**: RSI < 20, normal volume (capitulation phase)
**Why This Method:**
Behavioral finance principles (Kahneman, Tversky) show that markets follow predictable emotional cycles. Extreme psychological states often mark reversal points because:
- At Euphoria/Greed peaks, everyone bullish has already bought (no buyers left)
- At Panic/Despair bottoms, everyone bearish has already sold (no sellers left)
AMPM provides contrarian signals at these extremes while respecting trends during Fear and Greed intermediate states.
**Contribution to Confidence Score:**
- Psychology Bullish (Panic/Despair + RSI < 35) = +15 points
- Psychology Bearish (Euphoria/Greed + RSI > 65) = +15 points
- Neutral states = 0 points
---
### 4. Time-Decay Probability Zones (TDPZ)
**What It Does:**
Creates dynamic support and resistance zones based on statistical probability distributions that adapt to changing market volatility, similar to Bollinger Bands but with enhancements for trend environments.
**How It Works:**
- Calculates a 20-period Simple Moving Average as the basis line
- Computes standard deviation of price over the same period
- Creates four probability zones:
- **Extreme Upper**: Basis + 2.5 standard deviations (≈99% probability boundary)
- **Upper Zone**: Basis + 1.5 standard deviations
- **Lower Zone**: Basis - 1.5 standard deviations
- **Extreme Lower**: Basis - 2.5 standard deviations (≈99% probability boundary)
- Dynamically adjusts zone width based on ATR (Average True Range):
```
Adjusted Upper = Upper Zone + (ATR × adjustment_factor)
Adjusted Lower = Lower Zone - (ATR × adjustment_factor)
```
- The adjustment factor increases during high volatility, widening the zones
**Why This Method:**
Traditional support/resistance levels are static and don't account for volatility regimes. TDPZ zones are probability-based and mean-reverting:
- Price has ≈99% probability of staying within extreme zones in normal conditions
- Touches to extreme zones represent statistical outliers (high-probability reversal opportunities)
- Zone expansion/contraction reflects volatility regime changes
- ATR adjustment prevents false signals during unusual volatility
The "time-decay" concept refers to mean reversion - the further price moves from the basis, the higher the probability of eventual return.
**Contribution to Confidence Score:**
- Price in Lower Extreme Zone = +15 points (bullish reversal probability)
- Price in Upper Extreme Zone = +15 points (bearish reversal probability)
- Price near basis = 0 points
---
## 🎯 HOW THE CONFIDENCE SCORING SYSTEM WORKS
### Signal Generation Formula
QMH calculates separate Bullish and Bearish confidence scores each bar:
**Bullish Confidence (0-100%):**
```
Base Score: 20 points
+ TFR Bullish: 25 points (if all 4 timeframes aligned bullish)
+ CAQE Bullish: 25 points (if intermarket pressure positive)
+ AMPM Bullish: 15 points (if Panic/Despair contrarian signal)
+ TDPZ Bullish: 15 points (if price in lower probability zones)
─────────
Maximum Possible: 100 points
```
**Bearish Confidence (0-100%):**
```
Base Score: 20 points
+ TFR Bearish: 25 points (if all 4 timeframes aligned bearish)
+ CAQE Bearish: 25 points (if intermarket pressure negative)
+ AMPM Bearish: 15 points (if Euphoria/Greed contrarian signal)
+ TDPZ Bearish: 15 points (if price in upper probability zones)
─────────
Maximum Possible: 100 points
```
### Confirmed Signal Requirements
A **QBUY** (Quantum Buy) signal generates when:
1. Bullish Confidence ≥ User-defined threshold (default 60%)
2. Bullish Confidence > Bearish Confidence
3. No active sell signal present
A **QSELL** (Quantum Sell) signal generates when:
1. Bearish Confidence ≥ User-defined threshold (default 60%)
2. Bearish Confidence > Bullish Confidence
3. No active buy signal present
### Why This Approach Is Different
**Example Comparison:**
Traditional RSI Strategy:
- RSI < 30 → Buy signal
- Result: May buy into falling knife if trend remains bearish
QMH Approach:
- RSI < 30 → Psychology shows Panic (+15 points)
- But requires additional confirmation:
- Are all timeframes also showing bullish reversal? (+25 points)
- Is intermarket pressure turning positive? (+25 points)
- Is price at a statistical extreme? (+15 points)
- Only when total ≥ 60 points does a QBUY signal fire
This multi-layer confirmation dramatically reduces false signals while maintaining sensitivity to genuine opportunities.
---
## 🚫 NO REPAINT GUARANTEE
**QMH is designed to be 100% repaint-free**, which is critical for honest backtesting and reliable live trading.
### Technical Implementation:
1. **All Multi-Timeframe Data Uses Confirmed Bars**
```pinescript
tf1_close = request.security(syminfo.tickerid, "15", close , lookahead=barmerge.lookahead_off)
```
Using `close ` instead of `close ` ensures we only reference the previous confirmed bar, not the current forming bar.
2. **Lookahead Prevention**
```pinescript
lookahead=barmerge.lookahead_off
```
This parameter prevents the function from accessing future data that wouldn't be available in real-time.
3. **Signal Timing**
Signals appear on the bar AFTER all conditions are met, not retroactively on the bar where conditions first appeared.
### What This Means for Users:
- **Backtest Accuracy**: Historical signals match exactly what you would have seen in real-time
- **No Disappearing Signals**: Once a signal appears, it stays (though price may move against it)
- **Honest Performance**: Results reflect true predictive power, not hindsight optimization
- **Live Trading Reliability**: Alerts fire at the same time signals appear on the chart
The dashboard displays "✓ NO REPAINT" to confirm this guarantee.
---
## 📖 HOW TO USE THIS INDICATOR
### Basic Trading Strategy
**For Trend Followers:**
1. **Wait for Signal Confirmation**
- QBUY label appears below a bar = Confirmed bullish entry opportunity
- QSELL label appears above a bar = Confirmed bearish entry opportunity
2. **Check Confidence Score**
- 60-70%: Moderate confidence (consider smaller position size)
- 70-85%: High confidence (standard position size)
- 85-100%: Very high confidence (consider larger position size)
3. **Enter Trade**
- Long entry: Market or limit order near signal bar
- Short entry: Market or limit order near signal bar
4. **Set Targets Using Probability Zones**
- Long trades: Target the adjusted upper zone (lime line)
- Short trades: Target the adjusted lower zone (red line)
- Alternatively, target the basis line (yellow) for conservative exits
5. **Set Stop Loss**
- Long trades: Below recent swing low minus 1 ATR
- Short trades: Above recent swing high plus 1 ATR
**For Mean Reversion Traders:**
1. **Wait for Extreme Zones**
- Price touches extreme lower zone (dotted red line below)
- Price touches extreme upper zone (dotted lime line above)
2. **Confirm with Psychology**
- At lower extreme: Look for Panic or Despair state
- At upper extreme: Look for Euphoria or Greed state
3. **Wait for Confidence Build**
- Monitor dashboard until confidence exceeds threshold
- Requires patience - extreme touches don't always reverse immediately
4. **Enter Reversal**
- Target: Return to basis line (yellow SMA 20)
- Stop: Beyond the extreme zone
**For Position Traders (Longer Timeframes):**
1. **Use Daily Timeframe**
- Set chart to daily for longer-term signals
- Signals will be less frequent but higher quality
2. **Require High Confidence**
- Filter setting: Min Confidence Score 80%+
- Only take the strongest multi-dimensional setups
3. **Confirm with Resonance Background**
- Green tinted background = All timeframes bullish aligned
- Red tinted background = All timeframes bearish aligned
- Only enter when background tint matches signal direction
4. **Hold for Major Targets**
- Long trades: Hold until extreme upper zone or opposite signal
- Short trades: Hold until extreme lower zone or opposite signal
---
## 📊 DASHBOARD INTERPRETATION
The QMH Dashboard (top-right corner) provides real-time market analysis across all four dimensions:
### Dashboard Elements:
1. **✓ NO REPAINT**
- Green confirmation that signals don't repaint
- Always visible to remind users of signal integrity
2. **SIGNAL: BULL/BEAR XX%**
- Shows dominant direction (whichever confidence is higher)
- Displays current confidence percentage
- Background color intensity reflects confidence level
3. **Psychology: **
- Current market emotional state
- Color coded:
- Orange = Euphoria (extreme bullish emotion)
- Yellow = Greed (moderate bullish emotion)
- Gray = Neutral (balanced state)
- Purple = Fear (uncertainty)
- Red = Panic (extreme bearish emotion)
- Dark red = Despair (capitulation)
4. **Resonance: **
- Multi-timeframe alignment strength
- Positive = All timeframes bullish aligned
- Negative = All timeframes bearish aligned
- Near zero = Timeframes not synchronized
- Emoji indicator: 🔥 (bullish resonance) ❄️ (bearish resonance)
5. **Intermarket: **
- Cross-asset pressure measurement
- Positive = BTC/DXY/VIX correlations supporting upside
- Negative = Correlations supporting downside
- Warning ⚠️ if correlation breakdown detected
6. **RSI: **
- Current RSI(14) reading
- Background colors: Red (>70 overbought), Green (<30 oversold)
- Status: OB (overbought), OS (oversold), or • (neutral)
7. **Status: READY BUY / READY SELL / WAIT**
- Quick trade readiness indicator
- READY BUY: Confidence ≥ threshold, bias bullish
- READY SELL: Confidence ≥ threshold, bias bearish
- WAIT: Confidence below threshold
### How to Use Dashboard:
**Before Entering a Trade:**
- Verify Status shows READY (not WAIT)
- Check that Resonance matches signal direction
- Confirm Psychology isn't contradicting (e.g., buying during Euphoria)
- Note Intermarket value - breakdowns (⚠️) suggest caution
**During a Trade:**
- Monitor Psychology shifts (e.g., from Fear to Greed in a long)
- Watch for Resonance changes that could signal exit
- Check for Intermarket breakdown warnings
---
## ⚙️ CUSTOMIZATION SETTINGS
### TFR Settings (Temporal Fractal Resonance)
- **Enable/Disable**: Turn TFR analysis on/off
- **Fractal Sensitivity** (5-50, default 14):
- Lower values = More responsive to short-term changes
- Higher values = More stable, slower to react
- Recommendation: 14 for balanced, 7 for scalping, 21 for position trading
### CAQE Settings (Cross-Asset Quantum Entanglement)
- **Enable/Disable**: Turn CAQE analysis on/off
- **Asset 1** (default BTC): Reference asset for correlation analysis
- **Asset 2** (default DXY): Second reference asset
- **Asset 3** (default VIX): Third reference asset
- **Correlation Length** (10-100, default 20):
- Lower values = More sensitive to recent correlation changes
- Higher values = More stable correlation measurements
- Recommendation: 20 for most assets, 50 for less volatile markets
### Psychology Settings (Adaptive Market Psychology Matrix)
- **Enable/Disable**: Turn AMPM analysis on/off
- **Volume Spike Threshold** (1.0-5.0x, default 2.0):
- Lower values = Detect smaller volume increases as spikes
- Higher values = Only flag major volume surges
- Recommendation: 2.0 for stocks, 1.5 for crypto
### Probability Settings (Time-Decay Probability Zones)
- **Enable/Disable**: Turn TDPZ visualization on/off
- **Probability Lookback** (20-200, default 50):
- Lower values = Zones adapt faster to recent price action
- Higher values = Zones based on longer statistical history
- Recommendation: 50 for most uses, 100 for position trading
### Filter Settings
- **Min Confidence Score** (40-95%, default 60%):
- Lower threshold = More signals, more false positives
- Higher threshold = Fewer signals, higher quality
- Recommendation: 60% for active trading, 75% for selective trading
### Visual Settings
- **Show Entry Signals**: Toggle QBUY/QSELL labels on chart
- **Show Probability Zones**: Toggle zone visualization
- **Show Psychology State**: Toggle dashboard display
---
## 🔔 ALERT CONFIGURATION
QMH includes four alert conditions that can be configured via TradingView's alert system:
### Available Alerts:
1. **Quantum Buy Signal**
- Fires when: Confirmed QBUY signal generates
- Message includes: Confidence percentage
- Use for: Entry notifications
2. **Quantum Sell Signal**
- Fires when: Confirmed QSELL signal generates
- Message includes: Confidence percentage
- Use for: Entry notifications or exit warnings
3. **Market Panic**
- Fires when: Psychology state reaches Panic
- Use for: Contrarian opportunity alerts
4. **Market Euphoria**
- Fires when: Psychology state reaches Euphoria
- Use for: Reversal warning alerts
### How to Set Alerts:
1. Right-click on chart → "Add Alert"
2. Condition: Select "Quantum Market Harmonics"
3. Choose alert type from dropdown
4. Configure expiration, frequency, and notification method
5. Create alert
**Recommendation**: Set alerts for Quantum Buy/Sell signals with "Once Per Bar Close" frequency to avoid intra-bar false triggers.
---
## 💡 BEST PRACTICES
### For All Users:
1. **Backtest First**
- Test on your specific market and timeframe before live trading
- Different assets may perform better with different confidence thresholds
- Verify that the No Repaint guarantee works as described
2. **Paper Trade**
- Practice with signals on a demo account first
- Understand typical signal frequency for your timeframe
- Get comfortable with the dashboard interpretation
3. **Risk Management**
- Never risk more than 1-2% of capital per trade
- Use proper stop losses (not just mental stops)
- Position size based on confidence score (larger size at higher confidence)
4. **Consider Context**
- QMH signals work best in clear trends or at extremes
- During tight consolidation, false signals increase
- Major news events can invalidate technical signals
### Optimal Use Cases:
**QMH Works Best When:**
- ✅ Markets are trending (up or down)
- ✅ Volatility is normal to elevated
- ✅ Price reaches probability zone extremes
- ✅ Multiple timeframes align
- ✅ Clear inter-market relationships exist
**QMH Is Less Effective When:**
- ❌ Extremely low volatility (zones contract too much)
- ❌ Sideways choppy markets (conflicting timeframes)
- ❌ Flash crashes or news events (correlations break down)
- ❌ Very illiquid assets (irregular price action)
### Session Considerations:
- **24/7 Markets (Crypto)**: Works on all sessions, but signals may be more reliable during high-volume periods (US/European trading hours)
- **Forex**: Best during London/New York overlap when volume is highest
- **Stocks**: Most reliable during regular trading hours (not pre-market/after-hours)
---
## ⚠️ LIMITATIONS AND RISKS
### This Indicator Cannot:
- **Predict Black Swan Events**: Sudden unexpected events invalidate technical analysis
- **Guarantee Profits**: No indicator is 100% accurate; losses will occur
- **Replace Risk Management**: Always use stop losses and proper position sizing
- **Account for Fundamental Changes**: Company news, economic data, etc. can override technical signals
- **Work in All Market Conditions**: Less effective during extreme low volatility or major news events
### Known Limitations:
1. **Multi-Timeframe Lag**: Uses confirmed bars (`close `), so signals appear one bar after conditions met
2. **Correlation Dependency**: CAQE requires sufficient history; may be less reliable on newly listed assets
3. **Computational Load**: Multiple `request.security()` calls may cause slower performance on older devices
4. **Repaint of Dashboard**: Dashboard updates every bar (by design), but signals themselves don't repaint
### Risk Warnings:
- Past performance doesn't guarantee future results
- Backtesting results may not reflect actual trading results due to slippage, commissions, and execution delays
- Different markets and timeframes may produce different results
- The indicator should be used as a tool, not as a standalone trading system
- Always combine with your own analysis, risk management, and trading plan
---
## 🎓 EDUCATIONAL CONCEPTS
This indicator synthesizes several established financial theories and technical analysis concepts:
### Academic Foundations:
1. **Fractal Market Hypothesis** (Edgar Peters)
- Markets exhibit self-similar patterns across time scales
- Implemented via multi-timeframe resonance analysis
2. **Behavioral Finance** (Kahneman & Tversky)
- Investor psychology drives market inefficiencies
- Implemented via market psychology state classification
3. **Intermarket Analysis** (John Murphy)
- Asset classes correlate and influence each other predictably
- Implemented via cross-asset correlation monitoring
4. **Mean Reversion** (Statistical Arbitrage)
- Prices tend to revert to statistical norms
- Implemented via probability zones and standard deviation bands
5. **Multi-Timeframe Analysis** (Technical Analysis Standard)
- Higher timeframe trends dominate lower timeframe noise
- Implemented via fractal resonance scoring
### Learning Resources:
To better understand the concepts behind QMH:
- Read "Intermarket Analysis" by John Murphy (for CAQE concepts)
- Study "Thinking, Fast and Slow" by Daniel Kahneman (for psychology concepts)
- Review "Fractal Market Analysis" by Edgar Peters (for TFR concepts)
- Learn about Bollinger Bands (for TDPZ foundation)
---
## 🔄 VERSION HISTORY AND UPDATES
**Current Version: 1.0**
This is the initial public release. Future updates will be published using TradingView's Update feature (not as separate publications). Planned improvements may include:
- Additional reference assets for CAQE
- Optional machine learning-based weight optimization
- Customizable psychology state definitions
- Alternative probability zone calculations
- Performance metrics tracking
Check the "Updates" tab on the script page for version history.
---
## 📞 SUPPORT AND FEEDBACK
### How to Get Help:
1. **Read This Description First**: Most questions are answered in the detailed sections above
2. **Check Comments**: Other users may have asked similar questions
3. **Post Comments**: For general questions visible to the community
4. **Use TradingView Messaging**: For private inquiries (if available)
### Providing Useful Feedback:
When reporting issues or suggesting improvements:
- Specify your asset, timeframe, and settings
- Include a screenshot if relevant
- Describe expected vs. actual behavior
- Check if issue persists with default settings
### Continuous Improvement:
This indicator will evolve based on user feedback and market testing. Constructive suggestions for improvements are always welcome.
---
## ⚖️ DISCLAIMER
This indicator is provided for **educational and informational purposes only**. It does **not constitute financial advice, investment advice, trading advice, or any other type of advice**.
**Important Disclaimers:**
- You should **not** rely solely on this indicator to make trading decisions
- Always conduct your own research and due diligence
- Past performance is not indicative of future results
- Trading and investing involve substantial risk of loss
- Only trade with capital you can afford to lose
- Consider consulting with a licensed financial advisor before trading
- The author is not responsible for any trading losses incurred using this indicator
**By using this indicator, you acknowledge:**
- You understand the risks of trading
- You take full responsibility for your trading decisions
- You will use proper risk management techniques
- You will not hold the author liable for any losses
---
## 🙏 ACKNOWLEDGMENTS
This indicator builds upon the collective knowledge of the technical analysis and trading community. While the specific implementation and combination are original, the underlying concepts draw from:
- The Pine Script community on TradingView
- Academic research in behavioral finance and market microstructure
- Classical technical analysis methods developed over decades
- Open-source indicators that demonstrate best practices in Pine Script coding
Special thanks to TradingView for providing the platform and Pine Script language that make indicators like this possible.
---
## 📚 ADDITIONAL RESOURCES
**Pine Script Documentation:**
- Official Pine Script Manual: www.tradingview.com
**Related Concepts to Study:**
- Multi-timeframe analysis techniques
- Correlation analysis in financial markets
- Behavioral finance principles
- Mean reversion strategies
- Bollinger Bands methodology
**Recommended TradingView Tools:**
- Strategy Tester: To backtest signal performance
- Bar Replay: To see how signals develop in real-time
- Alert System: To receive notifications of new signals
---
**Thank you for using Quantum Market Harmonics. Trade safely and responsibly.**

ApexSignalsIve been working with pine code for a really long time now, took me about 6 months to build this script, hopefully it works well for you.very good for trading. will help you out a lot

Trading Toolkit - Comprehensive AnalysisTrading Toolkit – Comprehensive Analysis
A unified trading analysis toolkit with four sections:
📊 Company Info
Fundamentals, market cap, sector, and earnings countdown.
📅 Performance
Date‑range analysis with key metrics.
🎯 Market Sentiment
CNN‑style Fear & Greed Index (7 components) + 150‑SMA positioning.
🛡️ Risk Levels
ATR/MAD‑based stop‑loss and take‑profit calculations.
Key Features
CNN‑style Fear & Greed approximation using:
Momentum: S&P 500 vs 125‑DMA
Price Strength: NYSE 52‑week highs vs lows
Market Breadth: McClellan Volume Summation (Up/Down volume)
Put/Call Ratio: 5‑day average (inverted)
Volatility: VIX vs 50‑DMA (inverted)
Safe‑Haven Demand: 20‑day SPY–IEF return spread
Junk‑Bond Demand: HY vs IG credit spread (inverted)
Normalization: z‑score → percentile (0–100) with ±3 clipping.
CNN‑aligned thresholds:
Extreme Fear: 0–24 | Fear: 25–44 | Neutral: 45–54 | Greed: 55–74 | Extreme Greed: 75+.
Risk tools: ATR & MAD volatility measures with configurable multipliers.
Flexible layout: vertical or side‑by‑side columns.
Data Sources
S&P 500: CBOE:SPX or AMEX:SPY
NYSE: INDEX:HIGN, INDEX:LOWN, USI:UVOL, USI:DVOL
Options: USI:PCC (Total PCR), fallback INDEX:CPCS (Equity PCR)
Volatility: CBOE:VIX
Treasuries: NASDAQ:IEF
Credit Spreads: FRED:BAMLH0A0HYM2, FRED:BAMLC0A0CM
Risk Management
ATR risk bands: 🟢 ≤3%, 🟡 3–6%, ⚪ 6–10%, 🟠 10–15%, 🔴 >15%
MAD‑based stop‑loss and take‑profit calculations.
Author: Daniel Dahan
(AI Generated, Merged & enhanced version with CNN‑style Fear & Greed)

AI Trend Signal + Auto TrendLines [NinjADeviL]📈 AI Trend Signal + Auto TrendLines
The AI Trend Signal + Auto TrendLines indicator combines smart automatic trendline detection with AI-based market structure analysis to deliver precise real-time entry and exit signals.
🧠 Key Features:
🔹 Automatically detects upward and downward trendlines based on dynamic swing analysis.
🔹 Highlights breakout zones with clear visual alerts.
🔹 Built-in AI engine to forecast early trend reversals.
🔹 Integrates Smart Money Concepts (BOS / CHoCH).
🔹 Dynamic background and color-coded visualization for bullish/bearish trends.
🔹 Works across all timeframes and asset classes — stocks, forex, indices, and crypto.
⚙️ Fully Customizable:
Adjust colors, sensitivity, line styles, and alerts to fit your personal trading strategy and chart style.
💡 Perfect For:
Traders looking to identify high-probability breakouts, trend reversals, and key structural points in the market with clarity and accuracy.

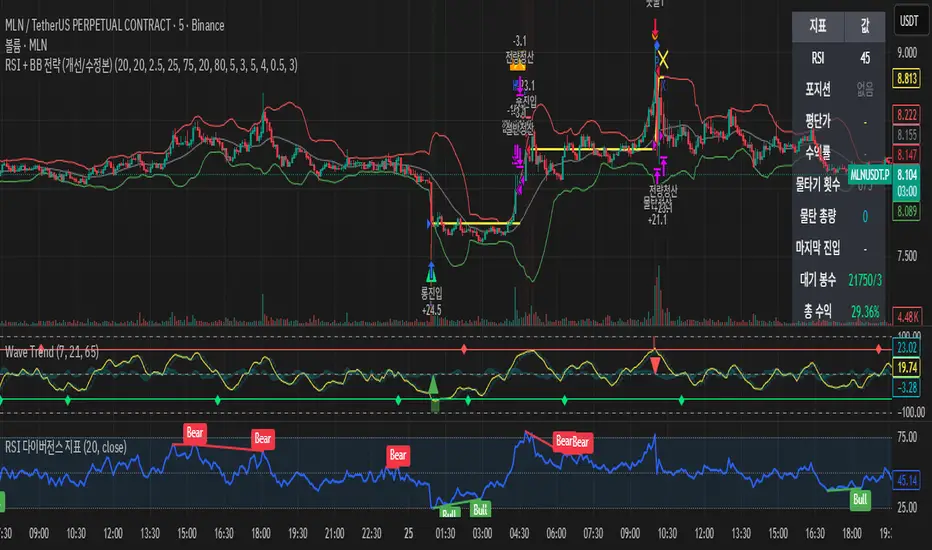
RSI + BB strategyBollinger Bands 20/2.5 + RSI 20-day 25/75
Long = Enter a long position when the price breaks below the Bollinger Band, the candlestick closes, and the RSI is below 25.
Short = Enter a short position when the price breaks above the Bollinger Band, the candlestick closes, and the RSI is above 75.
Take profit = Default setting: Take profit when profit is +4%. For safety, sell half of the position when profit is +2% to break even.
Lower average: -5% loss. If the RSI is 20/80, use the lower average. Sell the remaining amount when the price returns to its original price.
Based on 5-minute and 15-minute charts
Otherwise, signals will be difficult to obtain. For charts longer than 1 hour, adjust RSI and BB appropriately.

Monthly First-Day Range Breakout (Long-Only)Monthly First-Day Range Breakout (Long-Only)
When the Close is above the first candle of the month - Long
Wait for the First Day Close

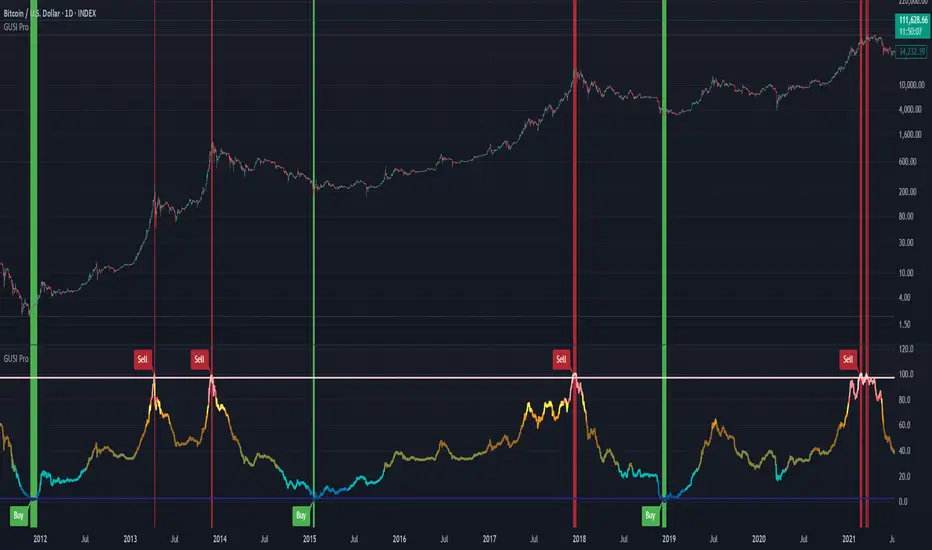
GUSI ProGUSI — Adaptive Bitcoin Cycle Risk Model
Most on-chain metrics published on TradingView — such as NUPL, MVRV, or Puell Multiple — were once reliable in past cycles but have lost accuracy. The reason is simple: their trigger levels are static, while Bitcoin’s market structure changes over time. Tops have formed lower each cycle, yet the traditional horizontal thresholds remain unchanged.
What GUSI does differently:
It introduces sloped trigger functions that decrease over time, adapting each metric to Bitcoin’s maturing market.
It applies long-term normalization methods (smoothing and z-score lookups) to reduce distortion from short-term volatility and extreme outliers.
It only includes signals that remain valid across all Bitcoin cycles since 2011, discarding dozens of popular on-chain ideas that fail even after adjustment.
How GUSI is built:
GUSI is not just a mashup of indicators. Each component is a proprietary, modified version of a known on-chain signal:
Logarithmic MACD with declining trigger bands
MVRV-Z Score Regression with cycle-aware slopes
Net Unrealized Profit/Loss Ratio normalized with dynamic z-scores
Puell Multiple with logarithmic decay
Weekly RSI momentum filter for bottoms
Optional Pi Cycle Top logic with sloped moving averages
These are combined into a composite risk scoring system (0–100). Every signal contributes to the score according to user-defined weights, and each can be toggled on/off. The end result is a flexible model that adapts to long-term changes in Bitcoin’s cycles while staying transparent in its logic.
How to use it:
Scores near 97 indicate historically high-risk conditions (cycle tops).
Scores near 2.5 highlight deep accumulation zones (cycle bottoms).
Background colors and labels make the conditions clear, and built-in alerts let you automate your strategy.
GUSI is designed for the INDEX:BTCUSD 1D chart and works best when viewed in that context.
In short: GUSI makes classic on-chain indicators relevant again by adapting them to Bitcoin’s evolving market cycles. Instead of relying on static thresholds that stop working over time, it introduces dynamic slopes, normalization, and a weighted composite framework that traders can adjust themselves.

[Aegis]Original Turtle System for CryptoAs Richard Dennis once said, "Even if I published all the Turtle rules in the newspaper right now, no one would be able to 'execute' them," and 40 years later, even in modern financial markets (like the crypto market) where all the conditions have been disclosed, this strategy continues to deliver amazing performance. The following outlines the original Turtle rules as disclosed by Curtis Faith in his book *Way of the Turtle*, and a TradingView algorithm that translates these rules for application in the crypto market.
---
### **The Original Turtle Trading Rules**
#### **1. Markets**
* Trade in liquid futures markets.
#### **2. Position Sizing**
The volatility measure, **N**, is used as the basis for all calculations.
**True Range (TR) Calculation:** Select the largest of the following three values:
* Current High - Current Low
* $|\text{Current High} - \text{Previous Close}|$ (Absolute Value)
* $|\text{Current Low} - \text{Previous Close}|$ (Absolute Value)
**N (Average True Range, ATR) Calculation:**
$$N = \frac{(19 \times \text{PDN} + \text{TR})}{20}$$
* **PDN:** Previous Day's N value
* **TR:** Current True Range
This is similar to a 20-day Exponential Moving Average, and is sometimes calculated using a Simple Moving Average.
**Unit Size Calculation:**
$$\text{Unit Size (Number of Contracts)} = \frac{1\% \text{ of Account Equity}}{(\text{N} \times \text{Dollars per Point})}$$
* **Dollars per Point (Tick Value):** The value of a 1-point change in price.
#### **3. Entries**
* **Entry:** Buy when the 55-day high is broken to the upside, and sell when the 55-day low is broken to the downside.
#### **5. Stops**
* The stop-loss for every unit is set at a price **2N** unfavorable from the entry price.
* For each additional unit added, the stop price for the **entire position** is adjusted favorably by **1/2 N**.
* In other words, the stop price of the last unit entered becomes the stop price for the entire position.
#### **6. Exits**
The exit rule for profitable positions (before a stop is hit) is as follows:
* **Long Positions:** Exit when the 20-day low is broken to the downside.
* **Short Positions:** Exit when the 20-day high is broken to the upside.
*Note: This exit rule is followed only if the price has moved up by a value greater than or equal to the N value multiplied by the criterion for changing the take-profit line (the original Korean text mentions a condition based on N, which is commonly interpreted as requiring a profit before applying the channel exit).*
리처드 데니스가 앞서 "내가 지금 당장 터틀의 모든 규칙을 신문에 공표한다고 해도 아무도 '실행'하지 못할 것"라고 말했듯 40년이 흘러 모든 조건이 공개된 현대 금융시장(크립토 시장)에서도 여전히 이 전략은 놀라운 퍼포먼스를 기록하고 있습니다. 아래는 커티스 페이스가 자신의 저서 '터틀의 방식'에 공개한 오리지널 터틀 규칙과 이를 알고리즘으로 변환하여 크립토마켓에 적용한 트레이딩뷰 알고리즘 입니다.
##### 1. 시장 (Markets)
• 유동성이 풍부한 선물 시장에서 거래한다.
##### 2. 포지션 크기 (Position Sizing)
변동성 측정 단위인 N을 모든 계산의 기초로 사용한다.
**True Range (TR) 계산:** 다음 세 가지 값 중 가장 큰 값을 선택한다.
- • 현재 고가 - 현재 저가
- • |현재 고가 - 전일 종가| (절대값)
- • |현재 저가 - 전일 종가| (절대값)
**N (Average True Range, ATR) 계산:**
N = (19 × PDN + TR) / 20
- • PDN: 이전 날의 N 값
- • TR: 현재 True Range
이는 20일 지수이동평균과 유사하며, 단순이동평균으로 계산하기도 한다.
**1 유닛(Unit)의 크기 계산:**
유닛 크기 (계약 수) = 계좌 자산의 1% / (N × 틱 가치)
• 틱 가치(Dollars per Point): 1포인트 변동 시의 가치
##### 3. 진입 (Entries)
- • 진입: 55일 고가를 상향 돌파하면 매수, 55일 저가를 하향 돌파하면 매도한다.
##### 5. 손절 (Stops)
- • 모든 유닛에 대한 손절 기준은 진입 가격으로부터 2N 만큼 불리한 가격에 설정한다.
- • 유닛이 추가될 때마다 전체 포지션의 손절 가격을 1/2 N 만큼 유리한 방향으로 상향 조정한다.
- • 즉, 마지막으로 진입한 유닛의 손절 가격이 전체 포지션의 손절 가격이 된다.
##### 6. 청산 (Exits)
손절에 도달하기 전 수익 중인 포지션의 청산 규칙은 다음과 같다.
- • 매수 포지션: 20일 저가를 하향 돌파할 때 청산한다.
- • 매도 포지션: 20일 고가를 상향 돌파할 때 청산한다.
단, N값에 익절선 변경 기준을 곱한 값 이상으로 가격이 상승할 경우, 위 규칙을 따른다.

VWAP Balance HeatmapVWAP Balance Heatmap visually highlights where price stands relative to the dynamic equilibrium of bullish and bearish VWAP averages. The indicator builds two running VWAP arrays — one for bullish candles, one for bearish — then plots their averages and the midpoint between them. It fills the space between price and this midpoint, coloring it green when price is above balance and red when below. The result is a smooth heatmap that reveals whether the market is trading in premium or discount zones, helping you see shifts in momentum and balance without clutter or lag.

Adaptive Volatility Bands | AlphaNattAdaptive Volatility Bands (AVB) | AlphaNatt
Professional-grade dynamic bands that adapt to market volatility and trend strength, featuring smooth gradient visualization for enhanced chart clarity.
🎯 CORE CONCEPT
AVB creates self-adjusting bands around a customizable basis line, expanding during trending markets and contracting during consolidation. The gradient fill provides instant visual feedback on price position within the volatility envelope.
✨ KEY FEATURES
5 Basis Types: Choose between SMA, EMA, ALMA, KAMA, or VWMA for the centerline calculation
Adaptive Band Width: Bands automatically widen in strong trends and tighten in ranging markets
Smooth Gradient Fills: 10-layer gradient on each side for professional depth visualization
Multiple Volatility Metrics: ATR, Standard Deviation, or Range-based calculations
Squeeze Detection: Identifies Bollinger/Keltner squeeze conditions for breakout anticipation
Dynamic Color States: Cyan (#00F1FF) for bullish, Magenta (#FF019A) for bearish conditions
📊 HOW IT WORKS
The basis line is calculated using your selected moving average type
Volatility is measured using ATR, StDev, or Range
Trend strength is quantified via linear regression
Band width adapts based on normalized trend strength (when enabled)
Gradient layers create smooth visual transitions from bands to basis
Color state changes based on price position and basis direction
🔧 PARAMETER GROUPS
Basis Configuration:
Basis Type: Moving average calculation method
Basis Length (20): Period for centerline calculation
ALMA Settings: Offset (0.85) and Sigma (6) for ALMA basis
Volatility Settings:
Volatility Method: ATR, Standard Deviation, or Range
Volatility Length (14): Lookback for volatility calculation
Band Multiplier (2.0): Distance of bands from basis
Adaptive Settings:
Enable Adaptive (true): Toggle dynamic band adjustment
Adaptation Period (50): Trend strength measurement window
Squeeze Detection:
BB/KC Parameters: Settings for squeeze identification
Expansion Threshold: Multiplier for expansion signals
📈 TRADING SIGNALS
Long Conditions:
Price crosses above basis
Basis line is rising
Band color shifts to cyan
Short Conditions:
Price crosses below basis
Basis line is falling
Band color shifts to magenta
💡 USAGE STRATEGIES
Trend Following: Trade with the basis direction when bands are expanding
Mean Reversion: Fade moves to outer bands during squeeze conditions
Breakout Trading: Enter on expansion signals after squeeze periods
Support/Resistance: Use bands as dynamic S/R levels
Position Sizing: Wider bands suggest higher volatility - adjust size accordingly
🎨 VISUAL ELEMENTS
Gradient Fills: 10 opacity layers creating smooth band transitions
Dynamic Colors: State-dependent coloring for instant trend recognition
Basis Line: Bold centerline changes color with trend state
Band Lines: Outer boundaries with matching state colors
⚡ BEST PRACTICES
The AVB indicator works optimally on liquid instruments with consistent volume. The adaptive feature performs best in trending markets but can generate false signals during choppy conditions. Consider using alongside momentum indicators for confirmation. The gradient visualization helps identify price position within the volatility envelope at a glance.
🔔 ALERTS INCLUDED
Long/Short Signals
Squeeze Conditions
Expansion Breakouts
Band Touch Events
Version 6 | Pine Script™ | © AlphaNatt

DTR & ATR with live zonesThis indicator is designed to help traders gauge the day's volatility in real-time. It compares the current Daily True Range (DTR)—the distance between the session's high and low—to the historical Average True Range (ATR).
The main purpose is to project potential price levels where the market might reach based on its average volatility. These levels (100% ATR, 150%, 200%, etc.) can be used as price targets. For instance, if you're in a long trade, you might consider taking partial or full profits as the price approaches these upper ATR extension levels. The indicator is highly customisable, allowing you to control the appearance of the ATR lines, zones, and labels to fit your charting preferences.
Core Concepts: ATR and DTR
To use this indicator effectively, it's important to understand its two main components:
Average True Range (ATR): This is a classic technical analysis indicator that measures market volatility. It calculates the average range of price movement over a specific period (e.g., 14 days). A higher ATR means the price is, on average, moving more, while a low ATR indicates less volatility. This script uses a higher timeframe ATR (e.g., Daily) to establish a stable volatility baseline for the current trading day.
Daily True Range (DTR): This is simply the difference between the current trading session's highest high and lowest low (session high - session low). It tells you how much the price has actually moved so far today.
The indicator's logic revolves around comparing the live, unfolding DTR to the historical, baseline ATR. An on-screen table conveniently shows this comparison as a percentage, to show how volatile the day has been.
How It Works: The Dynamic & Locked Mechanism
The most clever part of this indicator is how it draws the ATR levels. It operates in two distinct phases during the trading session:
Phase 1: Dynamic Expansion (Before DTR meets ATR)
At the start of the session, the DTR is small. The indicator calculates the remaining range needed to "complete" the 100% ATR level (difference = avg_atr - dtr). It then adds this remaining amount to the session high and subtracts it from the session low. This creates a "floating" 100% ATR range that expands dynamically as the session high or low is extended.
Phase 2: The Lock-in (After DTR meets or exceeds ATR)
Once the day's range (DTR) becomes equal to or greater than the avg_atr, the day has met its "expected" volatility. At this point, the levels lock in place. The indicator intelligently determines the anchor point for the locked range.
Once this primary 100% ATR range is established (either dynamically or locked), the script projects the other levels (150%, 200%, 250%, and 300%) by adding or subtracting multiples of the avg_atr from this base.
How to Use It for Trading
The primary use of this indicator is to set logical, volatility-based price targets.
Setting Profit Targets: If you enter a long position, the upper ATR levels (100%, 150%, 200%) serve as excellent areas to consider taking profits. A move to the 200% or 250% level often signifies an overextended or "exhaustion" move, making it a high-probability exit zone. For short positions, the lower ATR levels serve the same purpose.
Assessing Intraday Momentum: The on-screen table tells you how much of the expected daily range has been used. If it's early in the session and the DTR is only at 30% of the ATR, you can anticipate more significant price movement is likely to come. Conversely, if the DTR is already at 150% of ATR, the bulk of the day's move may already be complete.
Mean Reversion Signals: If the price pushes to an extreme level (e.g., 250% ATR) and shows signs of stalling (e.g., bearish divergence on an oscillator), it could signal a potential reversal or pullback, offering an opportunity for a counter-trend trade.
Key Settings
ATR Length & Smoothing Type: These settings control how the baseline ATR is calculated. The default 14 period and RMA smoothing are standard, but you can adjust them to your preference.
Session Settings: This is crucial. You must set the Market Session and Time Zone to match the primary trading hours of the asset you are analysing (e.g., "0930-1600" for the NYSE session).
Show Lines / Show Labels / Show Zones: The script gives you full control over the visual display. You can toggle each ATR level's lines, labels, and background zones individually to avoid a cluttered chart and focus only on the levels that matter to your strategy.

Renko BandsThis is renko without the candles, just the endpoint plotted as a line with bands around it that represent the brick size. The idea came from thinking about what renko actually gives you once you strip away the visual brick format. At its core, renko is a filtered price series that only updates when price moves a fixed amount, which means it's inherently a trend-following mechanism with built-in noise reduction. By plotting just the renko price level and surrounding it with bands at the brick threshold distances, you get something that works like regular volatility bands while still behaving as a trend indicator.
The center line is the current renko price, which trails actual price based on whichever brick sizing method you've selected. When price moves enough to complete a brick in the renko calculation, the center line jumps to the new brick level. The bands sit at plus and minus one brick size from that center line, showing you exactly how far price needs to move before the next brick would form. This makes the bands function as dynamic breakout levels. When price touches or crosses a band, you know a new renko brick is forming and the trend calculation is updating.
What makes this cool is the dual-purpose nature. You can use it like traditional volatility bands where the outer edges represent boundaries of normal price movement, and breaks beyond those boundaries signal potential trend continuation or exhaustion. But because the underlying calculation is renko rather than standard deviation or ATR around a moving average, the bands also give you direct insight into trend state. When the center line is rising consistently and price stays near the upper band, you're in a clean uptrend. When it's falling and price hugs the lower band, downtrend. When the center line is flat and price is bouncing between both bands, you're ranging.
The three brick sizing methods work the same way as standard renko implementations. Traditional sizing uses a fixed price range, so your bands are always the same absolute distance from the center line. ATR-based sizing calculates brick range from historical volatility, which makes the bands expand and contract based on the ATR measurement you chose at startup. Percentage-based sizing scales the brick size with price level, so the bands naturally widen as price increases and narrow as it decreases. This automatic scaling is particularly useful for instruments that move proportionally rather than in fixed increments.
The visual simplicity compared to full renko bricks makes this more practical for overlay use on your main chart. Instead of trying to read brick patterns in a separate pane or cluttering your price chart with boxes and lines, you get a single smoothed line with two bands that convey the same information about trend state and momentum. The center line shows you the filtered trend direction, the bands show you the threshold levels, and the relationship between price and the bands tells you whether the current move has legs or is stalling out.
From a trend-following perspective, the renko line naturally stays flat during consolidation and only moves when directional momentum is strong enough to complete bricks. This built-in filter removes a lot of the whipsaw that affects moving averages during choppy periods. Traditional moving averages continue updating with every bar regardless of whether meaningful directional movement is happening, which leads to false signals when price is just oscillating. The renko line only responds to sustained moves that meet the brick size threshold, so it tends to stay quiet when price is going nowhere and only signals when something is actually happening.
The bands also serve as natural stop-loss or profit-target references since they represent the distance price needs to move before the trend calculation changes. If you're long and the renko line is rising, you might place stops below the lower band on the theory that if price falls far enough to reverse the renko trend, your thesis is probably invalidated. Conversely, the upper band can mark levels where you'd expect the current brick to complete and potentially see some consolidation or pullback before the next brick forms.
What this really highlights is that renko's value isn't just in the brick visualization, it's in the underlying filtering mechanism. By extracting that mechanism and presenting it in a more traditional band format, you get access to renko's trend-following properties without needing to commit to the brick chart aesthetic or deal with the complications of overlaying brick drawings on a time-based chart. It's renko after all, so you get the trend filtering and directional clarity that makes renko useful, but packaged in a way that integrates more naturally with standard technical analysis workflows.

Multi-Moving Average (4x)Configurable moving average indicator where user can select up to 4 MA and configure SMA or EMA , color and width.

Nadaraya-Watson Envelope [Dynamic Adaptive Working]LuxAlgo'a kernel channel-based, modified for dynamic stochastic bandwidth adaptation.
Nadaraya-Watson Envelope , "NWE Adaptive (Working)"

CandleFlow — Adaptive-Colored Bollinger BandsEN — What it is
Classic Bollinger Bands with adaptive color. Bands turn green when the basis slope is rising and red when it is falling. Same BB math; only visuals adapt. Two-state only.
Features
• Works on any timeframe; built with daily crypto in mind
• Inputs: Length 20, Multiplier 2.0, MA Type (SMA/EMA/WMA), Slope Length, Up/Down thresholds, Band fill
• Alerts: Trend state turns Up / turns Down
Notes
• Invite-only access. Source code not provided.
• No profit guarantee; this is not financial advice.
KR — 요약
표준 볼린저 계산은 그대로, 기준선이 상승하면 초록/하락하면 빨강으로 자동 색상 전환. 일봉 크립토에 최적화. 입력값(기간 20, 배수 2.0, MA 타입, 기울기 길이, 상/하 임계값, 밴드 채우기), 알림(상승/하락 전환) 제공. 초대전용, 코드 비공개. 수익 보장 없음.
Trademark
Bollinger Bands® is a registered trademark of John Bollinger. Not affiliated or endorsed.
Relative Valuation OscillatorRelative Valuation Oscillator (RVO) Description
The Valuation_OTC.pine script is a Relative Valuation Oscillator for TradingView that compares the current asset against a reference asset (like Bitcoin, S&P 500, or Gold) to determine if it's relatively overvalued or undervalued.
Key Features:
1. Multiple Calculation Methods:
Simple Ratio - Compares price ratio deviation from average
Percentage Difference - Direct percentage comparison between assets
Ratio Z-Score - Statistical measure (standard deviations from mean)
Rate of Change Comparison - Compares momentum/performance
Normalized Ratio - 0-100 scale centered at zero
2. Customizable Settings:
Reference asset selection (default: BTC/USDT)
Adjustable lookback period (10-500 bars)
Optional smoothing with configurable period
Overbought/oversold level thresholds (default: ±1.5)
3. Trading Signals:
Overvalued - Oscillator above overbought level (red zone)
Undervalued - Oscillator below oversold level (green zone)
Neutral - Between thresholds
Crossover alerts for key levels
Divergence detection (bullish/bearish)
4. Visual Components:
Color-coded oscillator line (green when positive, red when negative)
Optional signal line for additional smoothing
Background shading for valuation zones
Information table showing current metrics and status
Shape markers for crossovers and divergences
5. Alert Conditions:
Overvalued/undervalued alerts
Zero-line crossovers
Divergence signals
This indicator is useful for pairs trading, relative strength analysis, and identifying when an asset is trading at extremes relative to a benchmark asset.

Session Anchor Lines (Asia, London, NY)futures relative to 4 HR chart ( it draws a line for each session open )

Smart Levels V8 + Anomaly Detection CombinedTATANKA Smart Levels + Anomaly Detection
A comprehensive analysis tool combining manual level tracking with statistical anomaly detection for identifying high-probability trading opportunities.
CORE FEATURES:
Manual Level System:
• Plot custom support/resistance levels with automatic inflection point tracking
• Color-coded bull/bear level visualization with adjustable positioning
• Real-time level crossing alerts with directional confirmation
• Multi-timeframe pivot integration for additional context
Anomaly Detection Engine:
• Identifies statistical deviations from price equilibrium
• Generates scored signals based on multiple confirmation factors
• Visual threshold bands show deviation zones
• Horizontal projection lines from anomaly points until broken or session end
Session Management:
• RTH/OVN session filtering with multiple timezone support
• Enhanced scoring during key market hours (opening hour, power hour)
• Option to block signals outside regular trading hours
• Session-specific visual backgrounds for clarity
Signal Intelligence:
• Automated confluence scoring combining price action, volume, and momentum
• Multiple signal types: bounces, breakouts, reversals, exhaustion patterns
• RSI and ADX integration for regime awareness
• Customizable cooldown periods to reduce signal noise
• Quality thresholds to filter low-probability setups
Market Bias Panel:
• Real-time display of current market sentiment
• Shows distance to key levels and signal readiness
• Configurable positioning and visibility options
Visual Customization:
• Adjustable signal sizes, colors, and transparency
• Optional large circles for high-quality setups
• Directional arrows and score labels
• Clean interface with minimal chart clutter
BEST PRACTICES:
• Recommended for 1m-15m timeframes on liquid futures/forex markets
• Paste your key levels at session start or when levels update
• Adjust sensitivity based on asset volatility (lower multipliers = more signals)
• Use signals as reference points within your overall trading plan
• Combine with additional confirmation from order flow or other tools
IMPORTANT NOTES:
• This is an indicator, not an automated strategy
• Signals represent potential opportunities requiring discretionary analysis
• Past performance does not guarantee future results
• Adjust parameters through backtesting on your specific instruments
DAMMU AUTOMATICAL AI ENRTY AND TARGET AND EXITMain Components
Supertrend System –
Detects market trend direction (Buy/Sell zones).
→ Green = Uptrend (Buy)
→ Red = Downtrend (Sell)
SMA Filter –
Uses 50 & 200 moving averages to confirm overall trend.
→ Price above both → Bullish
→ Price below both → Bearish
Buy/Sell Signals –
Generated when Supertrend flips direction and SMA confirms.
→ Triangle up = Buy
→ Triangle down = Sell
Take Profit / Stop Loss Levels –
Automatically calculated after Buy/Sell entry.
→ TP1, TP2, SL shown on chart
ADX (Sideways Zone Filter) –
If ADX < 25 → Market sideways → Avoid trades
Shows “No Trade Zone” area
Smart Money Concepts (SMC) Tools –
🔹 Market structure (HH, HL, LH, LL)
🔹 Order blocks (OB)
🔹 Equal highs/lows
🔹 Fair Value Gaps (FVG)
🔹 Premium & Discount zones
Helps find institutional entry points
Visual Display –
Color-coded background (trend zones)
Labels for buy/sell/structure
Optional FVG and order block boxes
Risk Management –
Input-based position sizing, SL & TP management
(to calculate profit levels and minimize loss)
