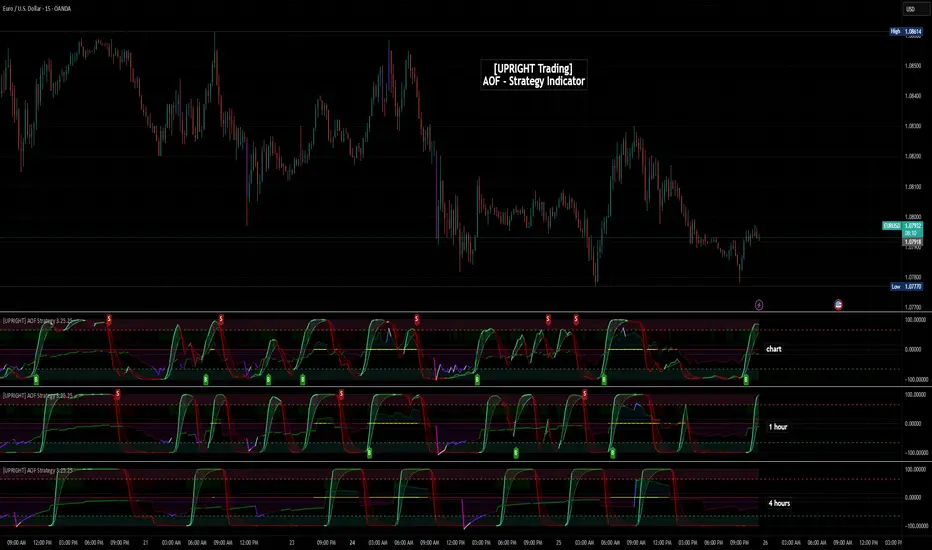
[UPRIGHT Trading] Academy of Forex - Scalp Strategy█ OVERVIEW
This is a collaboration of efforts of The Academy of Forex and UPRIGHT Trading .
The Academy of Forex - Scalp Strategy Indicator is a clean & reimagined lower indicator. To enable optimization & potential automation, we re-coded & optimized it at UPRIGHT Trading.
It is based on the one presented on its YT channel.
The idea is for it to be an easy to use - simple indicator - that works not just for confirmation, but also entering and exiting quickly (scalping).
█ CONCEPTS
The idea is that %B (derived from BBs) is able to pick up some pretty significant moves. With that as one of the bases the Inverse Fisher Transform (Ribbon) acts to show some of the movement of the asset highlighting when it at extremes. The RSI highlights are there as another confirmation to help normalize the sometimes too frequent movement of %B.
As expected the indicator often acts as a reversal indicator, but with the optimizations of logic it's able to pick up more than just the reversals and works as a pretty decent Buy/Sell Algorithm.
█ CALCULATIONS
Calculations used included, but not limited to:
- %B - Quantifies the price as a percentage to the Upper and Lower Band of the Popular Bollinger Bands, which were named after their inventor John Bollinger in 1980.
- Inverse Fisher Transform RSI - is a variation of the IFT, created by John Ehlers, the idea is for the IFT to convert Gaussian normal distribution and to take it a step further the RSI version is to just use overbought and oversold placements. This indicator is meant to highlight when price has moved to an extreme and in this process helps to spot turning points.
- Relative Strength Index (RSI) - As most of you know already the RSI is a technical analysis tool invented by J. Welles Wilder, that oscillates and is used to measure the momentum of price changes. It normalizes to index 0-100 with overbought and oversold defined by the user, but often around 70 as overbought and 30 as oversold.
- Pivot/Swing Points - Implemented to show recent Higher-Highs or Lower-Lows, Pivot points are included in the indicator for structure tracking.
- Moving Averages - Moving averages help to get an idea of when price is moving near the norm or outside to extremes.
█ FEATURES
Indicator Features:
-2 Buy/Sell Signals.
-U Signals (UPRIGHT optimized).
-Exit Reminders.
-Alerts allowing Automation of Scalp Strategy.
-H/L Swings.
-Color Customization.
-Clean Mode.
-Inverse Fisher Transform Ribbon.
-RSI Bullish/Bearish Highlights.
-Options for More Signals (including: Oversold/Overbought Circles, %B Bull/Bear Squares and Triangles, and IFT Highlights).
Showing some of the signals close up.
Should look like this:
Enjoy!
Sincerely,
Mike
Automation
TENKAN SCALPER STRATEGYTENKAN SCALP is a fully automatic trading system.
It is a continuation of our previous ichimoku release. This time however we throw out the rule book and use ICHIMOKU in a very different way.
It applies non traditional money management tactics.
While most trading strategies rely on a stop loss and a take profit target to manage risk. This strategy uses either no stop loss at all or a time based stop loss.
You might ask yourself the question why would you keep a trade open if it goes against you? Here are a phew reasons why the script does what it does.
Forex Markets consolidate most of the time. If you wait long enough your Take Profit will get hit anyways most of the time
You don't have to risk everything per trade. I keep my orders small so to keep some powder to get into some more trades
All the extra trades you take while one trade is in drawdown limit the drawdown as they provide cashflow
On lower timeframes the markets are so chaotic that a stop loss is very likely to get hit by a wick
About backtest below
This backtest uses a spread of 2 pips for entries and a default position size of 100% of equity. This is only possible on exchanges where spread is low and you have 10:1 leverage or more. It does not represent results obtainable without leverage. Do take into account that there are a lot of forex exchanges that provide this leverage, however a 2 pip spread is not always guaranteed and only applies to major pairs.
This backtest does not use the TIME BASED STOPS functionality.
Always start with small position sizing and see how the strategy performs before adding risk.
Explanation of variables:
Chikou(lagging span): pink line, this is price plotted 26 bars ago. People ignore the power of this it is crucial to see how chikou behaves towards past price action as seen in the chart below where we got an entry at red arrow because chikou bounced from past fractal bottom.
Kijun-Sen(base line): Black line or color coded line. This is the equilibrium of last 26 candles. To me this is the most important line in the system as it attracts price.
Kijun = (Highest high of 26 periods + Lowest low of 26 periods) ÷ 2
Tenkan-Sen(conversion line): Blue line. This is the equilibrium of last 9 candles. In a strong uptrend price stays above this line.
Tenkan = (Highest high of 9 periods + Lowest low of 9 periods) ÷ 2
Senkou A (Leading span A)= Pink cloud line, this is the average of the 2 components projected 26 bars in the future.
Senkou A = (Tenkan + Kijun) ÷ 2
Senkou B (Leading span B) = Green cloud line, this is the 52 day equilibrium projected 26 bars in the future.
Senkou B = (Highest high of prior 52 periods + Lowest low of prior 52 periods) ÷ 2
projection: Script uses same function for variable calculation and substracts a number on each next bar as to make a projection of where the variable will be in future bars if price stayed the same. This works as ICHIMOKU calculations use the middle point of a past set of data. The shorter that amount of bars will be in line with the data that it will be restricted to in future if price stayed the same.
Detection of Market Environment
To enter trades the script uses a lot of ICHIMOKU concepts. Contrary to how most people trade ICHIMOKU this script takes an environment that ICHIMOKU identifies as trending upwards and shorts in that environment. The same will be applied to a downtrend where it will open LONGS.
List of CRITERIA for a trend:
Grapling Hook: this is a component based on the chikou span (closing price displaced 26 bars into the past). The script will use an ATR based range to define a possible future projection to the CHIKOU line. For a market to be bullish there should be no price action happening within this area. Market is free to move upwards. Vice versa for bearish .
Kumo Cloud: script will check if price is above the cloud for bullish trend and below cloud for bearish trend .
Chikou above Kijun: script will check if the chikou line is above the KIJUN line of 26 bars ago. This is further confirmation that price is trending high enough compared to it's past data. Vice versa for downtrend.
Kijun projection: script will check if past Kijun is lower than future projected Kijun. This to ensure we get an equilibrium in our favour in the future. Vice versa for downtrend
Tenkan projection: script will check if future Tenkan-sen will be higher than Kijun-sen for an uptrend. Vice versa for downtrend.
Cloud projection: script will check if in 9 bars the Senkou Span A will be higher than Senkou Span B for an uptrend. Vice versa for downtrend.
Example:
This script does not visualise the prediction lines like I show in the example. I show them here to clarify how the script works.
Usage
Backtests are not indicative of future results, although a trader may want to use a strategy script to have a deeper understanding of how their strategy responds to varying market conditions, or as a tool for identifying possible flaws for a strategy that may be indicative of good or bad performance in the future.
Strategy Settings:
Minimum Body Size (atr): this is the minimum ATR a signal bar needs to be for entry. This is useful because our TP is based on previous bar.
Lot size per trade: this setting does not impact backtest. It is used to for the signals to let tradingconnect.com know your position size.
Direction: do you want to trade longs or shorts. I personally use both a long bot and a short bot at the same time.
Positions Allowed: the amount of positions the script will keep open as a maximum. You do not want to open too many positions, this is for risk management.
Close all positions at drawdown: if total open positions loss gets to this % target it will close all positions.
MetaTrader Prefix: when the script sends a signal it will put this text right before the symbol name from syminfo.ticker
MetaTrader Suffix: when the script sends a signal it will put this text right after the symbol name from syminfo.ticker
Charts below are some examples on how the script handles orders on default settings:
without time based SL
with time based SL
how it handles pyramiding
www.tradingview.com
Tradingconnector.com:
For full automation of the forex market the script uses this connector to execute trade on MT4. The alerts the script sends using the alerts() function call are structured in a way tradingconnector will recognise and send directly to MT4. You can find documentation about this tool on their own website.
Personal recommendation is to start with a minimum lot size and track performance, if you are comfortable scale the size up. You can do that by increasing the lot size setting in the script and making a new alert. Make sure to delete the old one.
How to access
You can see the Author's Instructions below to visit our telegram to get more information on how to get access.

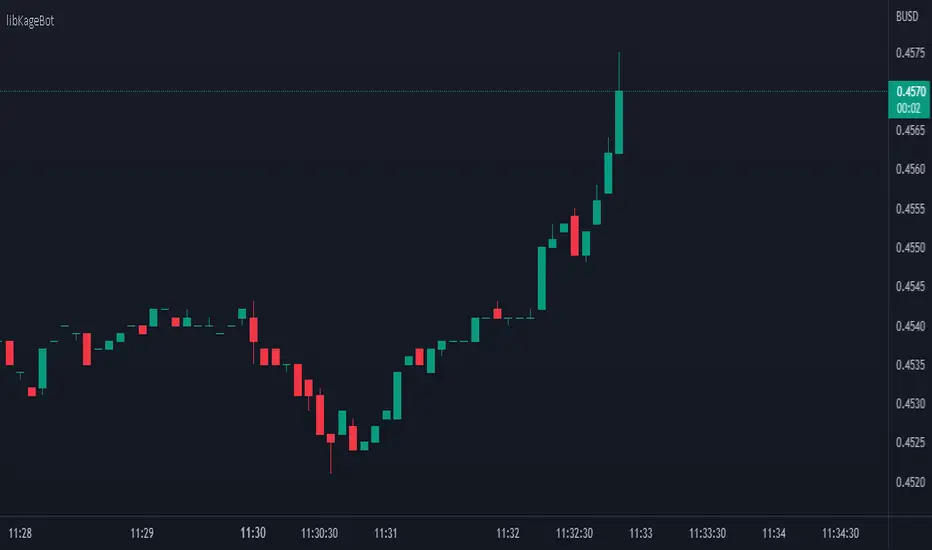
libKageBotLibrary "libKageBot"
Library of function to generate command strings for bots FrostyBot and Zignally. This version ONLY WORKS WITH FROSTYBOT.
strSize(_sizePercent, _sizeCurrency)
Converts a float to a formated string suitable to position size in percentage or currency. At leaste one parameter must be given
Parameters:
_sizePercent : (float) Position size in percent value. Optional. Default = na. Mandatory if _sizeCurrency is not given.
_sizeCurrency : (float) Position size in currency value. Optional. Default = na. Mandatory if _sizePercent is not given.
Returns: (string) A formated string containing the position size
entry(_bot, _direction, _sizePercent, _sizeCurrency)
Generates a simple entry command string for a bot
Parameters:
_bot : (TradeBot) Previously instancied bot type variable
_direction : (string) Flag to opena long or a short position. Must be either DIRECTION_LONG or DIRECTION_SHORT constant
_sizePercent : (float) Position size in percent value. Optional. Default = na. Mandatory if _sizeCurrency is not given.
_sizeCurrency : (float) Position size in currency value. Optional. Default = na. Mandatory if _sizePercent is not given.
Returns: (string) A string of a simple open position command
exit(_bot, _sizePercent, _sizeCurrency, _reduce)
Generates a simple exit command string for a bot
Parameters:
_bot : (TradeBot) Previously instancied bot type variable
_sizePercent : (float) Position size in percent value. Optional. Default = na. Mandatory if _sizeCurrency is not given.
_sizeCurrency : (float) Position size in currency value. Optional. Default = na. Mandatory if _sizePercent is not given.
_reduce : (bool) Flag to use Ruce Only option on Binance positions. Optional. Default = true
Returns: (string) A string of a simple close position command
cancelAll(_bot)
Generates a command string for a bot that cancels all open orders
Parameters:
_bot : (TradeBot) Previously instancied bot type variable
Returns: (string) A string of a command to cancel all open orders
leverage(_bot, _leverage, _type)
Generates a command string for a bot to set leverage
Parameters:
_bot : (TradeBot) Previously instancied bot type variable
_leverage : (int) The amount of leverage to be used when opening a position. Optional. If does not given, the bot's default will be used
_type : (string) Type of leverage. Must be either LEVERAGE_CROSS or LEVERAGE_ISOLATED. Optional. Default is LEVERAGE_CROSS.
Returns: (string) A string of a simple leverage command
entryLong(_bot, _leverage, _leverageType, _sizePercent, _sizeCurrency)
Generates a complete long entry command string for a bot
Parameters:
_bot : (TradeBot) Previously instancied bot type variable
_leverage : (int) The amount of leverage to be used when opening a position. Optional. If does not given, the bot's default will be used
_leverageType : (string) Type of leverage. Must be either LEVERAGE_CROSS or LEVERAGE_ISOLATED. Optional. Default is LEVERAGE_CROSS.
_sizePercent : (float) Position size in percent value. Optional. Default = na. Mandatory if _sizeCurrency is not given.
_sizeCurrency : (float) Position size in currency value. Optional. Default = na. Mandatory if _sizePercent is not given.
Returns: (string) A string of a complete open long position command
entryShort(_bot, _leverage, _leverageType, _sizePercent, _sizeCurrency)
Generates a complete short entry command string for a bot
Parameters:
_bot : (TradeBot) Previously instancied bot type variable
_leverage : (int) The amount of leverage to be used when opening a position. Optional. If does not given, the bot's default will be used
_leverageType
_sizePercent : (float) Position size in percent value. Optional. Default = na. Mandatory if _sizeCurrency is not given.
_sizeCurrency : (float) Position size in currency value. Optional. Default = na. Mandatory if _sizePercent is not given.
Returns: (string) A string of a complete open short position command
exitPosition(_bot, _sizePercent, _sizeCurrency, _reduce)
Generates a complete close position command string for a bot
Parameters:
_bot : (TradeBot) Previously instancied bot type variable
_sizePercent : (float) Position size in percent value. Optional. Default = na. Mandatory if _sizeCurrency is not given.
_sizeCurrency : (float) Position size in currency value. Optional. Default = na. Mandatory if _sizePercent is not given.
_reduce : (bool) Flag to use Ruce Only option on Binance positions. Optional. Default = true
Returns: (string) A string of a comlete close position command
printBot(_bot, _command)
Print bot's information for debug purposes
Parameters:
_bot : (TradeBot) Previously instancied bot type variable
_command : (string) A command string to be debugged
Returns: Nothing.
Constants
Constants to be used in both in internal and external code
Fields:
SERVER_FROSTBOT : (string) Identifier to FrostyBot
SERVER_ZIGNALY : (string) Identifier to Zignaly
DIRECTION_LONG : (string) Flag to open a long position
DIRECTION_SHORT
LEVERAGE_CROSS : (string) Flag to set leverage to cross
LEVERAGE_ISOLATED : (string) Flag to set leverage to isolated
TradeBot
Bot type to handle its essential information
Fields:
server : (string) Type o server. Must me one of the SERVER_* constant values
id : (string) Id of the account in the server (Stub for FrostyBot or Key to Zignally)
symbol : (string) Symbol of the pair to be negotiated (example: ETH/USDT)
leverage : (int) Leverage coeficient. Default is 1
Heikin Ashi SupertrendAbout this Strategy
This supertrend strategy uses the Heikin Ashi candles to generate the supertrend but enters and exits trades using normal candle close prices. If you use the standard built in Supertrend indicator on Heikin Ashi candles, it will produce very unrealistic backtesting results because it uses the Heikin Ashi prices instead of the real prices. However, by signaling the supertrend reversals using Heikin Ashi while using standard candle close prices for the entries and exits, it corrects the backtesting errors and gives you a more realistic equity curve. You should set the chart to use standard candles and then hide them (the strategy creates the candles).
This strategy includes:
Plotting of Heikin Ashi candles
Heikin Ashi Supertrend
Long and Short Entry Signals
Move stop loss after trade is X% in profit
Profit Target
Stop Loss
Built in Alertatron automation
Alertatron Trade Automation Integration
For Alertatron integration, be sure to configure the strategy settings and "Enable Webhook Messages" before creating an alert with {{strategy.order.alert_message}} in the body of your alert message. Be sure to enable webhooks and point it to your Incoming Alertatron webhook URL.
Notes
While this strategy does pretty well during trending markets, It's worth noting that the Buy and Hold ROI is much better during peak times of the bull market
Not financial advice. Do not risk more than you can afford to lose.

SuperTrend Multi Time Frame Long and Short Trading Strategy
Hello All
This is non-repainting Supertrend Multi Time Frame script, I got so many request on Supertrend with Multi Time Frame. This is for all of them ..I am making it open for all so you can change its coding according to your need.
How the Basic Indicator works
SuperTrend is one of the most common ATR based trailing stop indicators.
In this version you can change the ATR calculation method from the settings. Default method is RMA.
The indicator is easy to use and gives an accurate reading about an ongoing trend. It is constructed with two parameters, namely period and multiplier. The default values used while constructing a Supertrend indicator are 10 for average true range or trading period and three for its multiplier.
The average true range (ATR) plays an important role in 'Supertrend' as the indicator uses ATR to calculate its value. The ATR indicator signals the degree of price volatility .
The buy and sell signals are generated when the indicator starts plotting either on top of the closing price or below the closing price. A buy signal is generated when the ‘Supertrend’ closes above the price and a sell signal is generated when it closes below the closing price.
It also suggests that the trend is shifting from descending mode to ascending mode. Contrary to this, when a ‘Supertrend’ closes above the price, it generates a sell signal as the colour of the indicator changes into red.
A ‘Supertrend’ indicator can be used on spot, futures, options or forex, or even crypto markets and also on daily, weekly and hourly charts as well, but generally, it fails in a sideways-moving market.
How the Strategy works
This is developed based on SuperTrend.
Use two time frame for confirm all entry signals.
Two time frame SuperTrend works as Trailing stop for both long and short positions.
More securely execute orders, because it is wait until confine two time frames(example : daily and 30min)
Each time frame developed as customisable for user to any timeframe.
User can choose trading position side from Long, Short, and Both.
Custom Stop Loss level, user can enter Stop Loss percentage based on timeframe using.
Multiple Take Profit levels with customisable TP price percentage and position size.
Back-testing with custom time frame.
This strategy is develop for specially for automation purpose.
The strategy includes:
Entry for Long and Short.
Take Profit.
Stop Loss.
Trailing Stop Loss.
Position Size.
Exit Signal.
Risk Management Feature.
Backtesting.
Trading Alerts.
Use the strategy with alerts
This strategy is alert-ready. All you have to do is:
Go on a pair you would like to trade
Create an alert
Select the strategy as a Trigger
Wait for new orders to be sent to you
This is develop for specially for automating trading on any exchange, if you need to get that automating service for this strategy or any Tradingview strategy or indicator please contact me I am have 8 year experience on that field.
I hope you enjoy it!
Thanks,
Ranga

Trailing Stop SnippetThis is an example snippet that should allow for adding a trailing stop and trailing stop activation to almost any script.
You can use it by setting a trailing stop alone. This will provide you standard trailing stop functionality allowing you to lock in profits and increase your stop-loss as the price moves in your direction.
You can also set the trailing stop activation to trigger the original trailing stop at a certain level. "Once price rises 5%, set a trailing stop at break even". This would be set as 5 and 5 in the settings.

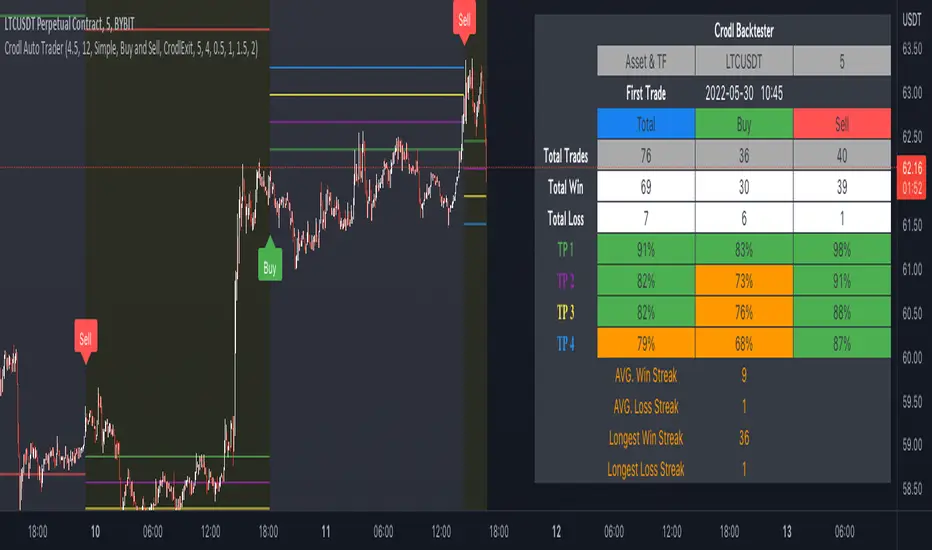
Crodl Auto TraderI've added Buy & Sell Flags - They will be used to add Longs and Shorts Flags as well as the ability to add alerts on them.
What triggers the Buy signal?
Buy signal = This indicator make use of the rsi (Relative Strength Index) to look at specific overbought and oversold levels as confirmation if it is an uptrend and not overbought yet. This will indicate that a long opportunity will be possible.
The SMA (slow moving average) is being used to calculate where to entry as it uses Crossed SMA's for entries.
SMA and EMA Crosses with the RSI (not overbought) will give as a buy signal if the SMA cross the EMA.
Sell signal = When the Rsi is not oversold this will give a good confirmation that the market still has downwards potential and it will wait for a cross on the SMA and EMA when crossed over for a sell signal. If we get a cross but the RSI is oversold that will be seen as a bad signal and it will be avoided.
Take Profit - Currently there are 4 Hardcoded Targets and on the backtester you will see the results for all 4 separately on the Info Panel.
The 4 green lines (TP)
1st line is at 0.5% market move, 2nd line is at 1% market move ,3rd one is at 1.5% market move and the last and 4th line is at 2%.
This will be where it will take profit unless you set the Exit Strategy to Opposite then it will use the opposite flags to exit.
So when it is set to Opposite and the previous flag was a long then it will exit on the next short flag and when the previous flag was a short flag then it will exit on the next long flag.
if the exit strategy is set to CrodlExit it will use an ATR based exit. so if the previous flag was a short it will wait for price to cross an ATR level then it will close the short and the same if the last flag was a long it will only be closed if a TP (green line) level has been reached or the ATR level for an exit.
if the Exit Strategy has been set to Fixed SL then you can set the sl at a specific %. if you set the Fixed SL at 2% that means if the last flag was a buy signal then if the TP targets was not reached first and the market moves downwards by 2% it will exit and wait for the next flag, if you are in a short and the TP level was not reached if the market moves 2% upwards it will close your short.
Backtest Data has 3 options. You can choose for it to show both Long(Buy) and short(sell) or just Buy or just Sell data.
Statistics Type will show you the info panel on the right. if you set it on Simple you will see the following data
Asset that you are currently on as well as the timeframe.
and the date it starts reading data to plot entries from. this will change depending on the timeframe that you are on. since higher timeframes will show you candles from longer time back as lower time frames.
Total = The amount of buy and sell flags since the first trade data and buy will give you the buy amount flags shown since that date and sell will show you the amount of sell flags since the start date.
Total win = this will tell you how many trades reached the TP (green lines) before a exit condition was met.
Total loss = this will show you how many of the flags exited based on the exit type selected before a TP target was reached.
TP1= how many time we reached the first target level at 0.5%
TP2= how many time we reached the second target level at 1.0%
TP3= how many time we reached the third target level at 1.5%
TP4= how many time we reached the fourth target level at 2.0%
the % are calculated from the total wins and total losses and it will give you the % difference.
If the % is bigger than 80 it will have a green background and if its less than 80% but more than 50% then it will be orange, if it is less than 50% it will be red.
win streak is the average of how many times we reached the profit target in a row before we reached an exit target based on the exit strategy
Loss streak is the average of how Many losses we had in a row before we reached the TP1 level
Longest Winning streak is how many times after one win we had another wining trade meaning TP reached before a stop level based on the exit strategy
Longest losing streak is the amount of times we reached the SL level based on the exit strategy before reaching a TP level or the opposite flag depending on the setting based on exit strategy.
to hide the info panel you can set the statistics to Coming soon.
Alerts can be set on all the TP targets and Entries(Buy and Sell flag) as well as all the exit strategies.
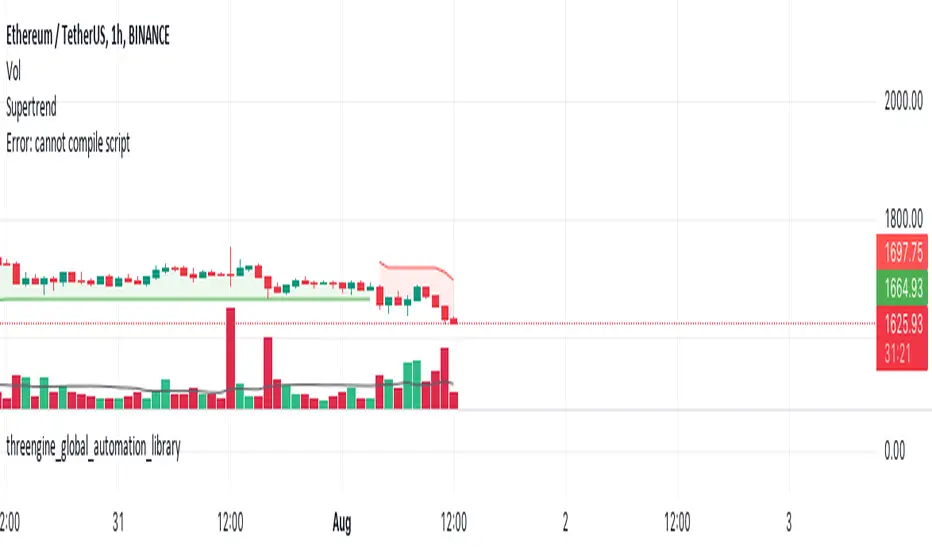
threengine_global_automation_libraryLibrary "threengine_global_automation_library"
A collection of functions used for trade automation
getBaseCurrency()
Gets the base currency for the chart's ticker. Supported trade pairs are USD, USDT, USDC, BTC, and PERP.
Returns: Base currency as a string
getChartSymbol()
Get the current chart's symbol without the base currency appended to it. Supported trade paris are USD, USDT, USDC, BTC, and PERP.
Returns: Ssymbol and base currency
getDecimals()
Calculates how many decimals are on the quote price of the current market
Returns: The current deimal places on the market quote price
checkVar()
Plot a string as a label on the chart to test variable value. Use str.tostring() for any variable that isn't a string.
Returns: Label with stringified variable
getStrategyAlertMessage()
Generates stringified JSON for a limit order that can be passed to the strategy alert_message for a long entry.
Returns: Stringifed JSON for a long entry
taGetAdx()
Calculates the Average Directional Index
Returns: The value of ADX as a float
taGetEma()
Calculates the EMA based on a type, source, and length. Supported types are EMA, SMA, RMA, and WMA.
Returns: The value of the selected EMA
isBetweenTwoTimes()
Checks to see if within a rage based on two times
@retunrs true/false boolean
getAllTradeIDs()
This gets all closed trades and open trades
@retunrs an array of all open and closed trade ID's
getOpenTradeIDs()
This gets all open trades
@retunrs an array of all open trade ID's
orderAlreadyExists()
This checks to see if a provided order id uses the getAllTradeIDs() function to check
@retunrs an array of all open and closed trade ID's
orderCurrentlyExists()
This checks to see if a provided order id uses the getAllTradeIDs() function to check
Returns: an array of all open and closed trade ID's
getContractCount()
calulates the number of contracts you can buy with a set amount of capital and a limit price
Returns: number of contracts you can buy based on amount of capital you want to use and a price
getLadderSteps()
Returns: array of ladder entry prices and amounts based on total amount you want to invest across all ladder rungs and either a range between ladderStart and LadderStop based on specificed number of ladderRungs OR ladderStart, ladderRungs, and LadderSpacingPercent
Honest Algo PremiumThis toolkit is a collection of innovative indicators, carefully designed to be as user friendly as possible. Get access to a collection of all the best we can offer in one indicator.
Providing Multiple Trading Styles
Our toolkit works in any market but has been specifically designed for Bitcoin and Forex.
Detect the direction of the trend using an algorithm based on our bounce manager ATR consolidation filtering
Find bounces from a handful of different pre-determined lines, the include a 20 period EMA, a supertrend, a T3 moving average and kijun-sen
Detect Rob Smith #thestrat entries
Filter out noise with our environment filters
and much more. (Check the changelog below for future additions)
If you want more information on how the price action entries of Rob Smith #thestrat work, there are many tutorials on the internet.
When using Rob Smith #thestrat entries the indicator uses bounce manager with a 200 period EMA for trend based bar coloring.
A quick explanation how it finds bounces from these lines:
Filter signals based on timeframe continuity
Timeframe continuity is a method of market analysis where you look if multiple different timeframe charts are in the same direction.
For example:
default settings we are in bull territory when the yearly, the quarterly, the monthly and the weekly candle all are green.
default settings we are in bear territory when the yearly, the quarterly, the monthly and the weekly candle all are red.
We provided multiple presets but it is recommended to use the standard preset, timeframe continuity is the strongest when using higher timeframes.
Filter signals based on market environment
We realised that trading long or short in an environment with no resistances increased our algorithms success rate.
How the algorithm does this:
1: See which timeframes the user has selected as a filter, on default these are:
Needs to be outside timeframe 1 (yearly), false
Needs to be outside timeframe 2 (quarterly), false
Needs to be outside timeframe 3 (monthly), true
2: Check if our closing price is above those timeframes previous candle high or below previous candle low.
This in combination with timeframe continuity gives a great tool to find the sentiment of the market and trade in the direction of the market.
Turn on autopilot using our signals
This tool is not made to do all decisions for you and requires a manager (you). The basic strategy using the #thestrat preset is to scale into positions on the 4H or higher timeframe, whenever a signal is fired you add to your position and as trend keeps developing the tool will keep adding to your positions.
A good manager knows risk management and does not use a very large position size per entry and builds a position over time.
We recommend you use a timeframe of 4H or higher and diversify over multiple assets. The indicator works best on assets that overtime have created long lasting trends.
Examples of perfect coins to use this on.
We know traders love clean looking charts
This is wy we added some popular indicators to our toolkit, these you can find on tradingview for free but we added them into our toolkit using our color theme, you can find these in the settings under (extra tools).
We also added an option to display bounce source, this is the source line some of our signal presets use to find bounces from using preset bounce manager parameter.

AlphaTrend For ProfitViewThis strategy is based on the AlphaTrend indicator by KivancOzbilgic A full description of this algorithm functionality may be found by clicking the linked image above.
Changes and/or additions:
It is now a backtestable strategy
Updated alert trigger logic
Easy integration with ProfitView to use this algorithm for automated trading
When you create an alert, and you are using ProfitView, select " alert() function calls only " as the condition option. If you would rather set your own custom alert message, select " Order fills only " instead.
There is a selectable setting in the options to trigger alert() function calls immediately, that you may use to see what text it will send.

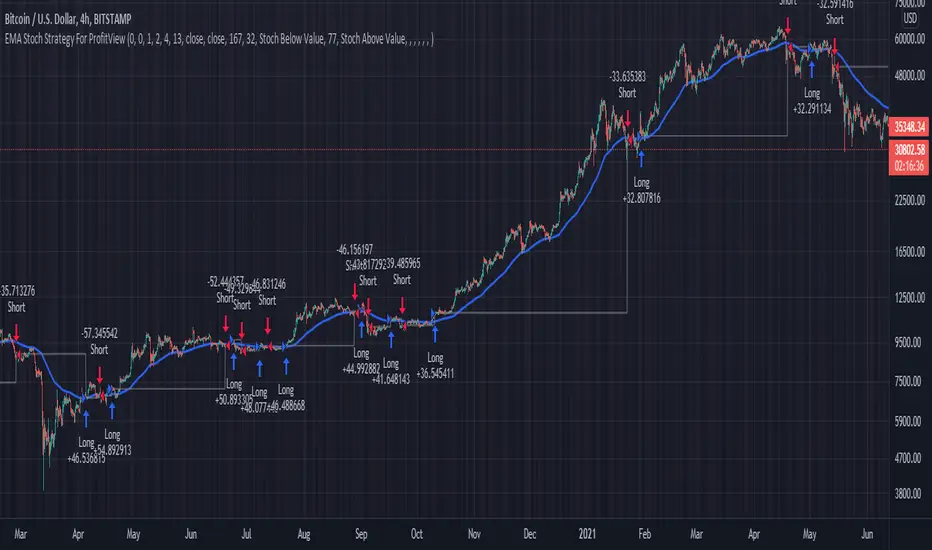
EMA Stoch Strategy For ProfitViewThis strategy will enter positions when the set stochastic conditions are met, and uses the moving average to filter the direction of the trades (long/short). The background is used to illustrate the strength of the stochastic values.
The following is a step by step guide in order to automate the trading of the strategy with ProfitView:
In the indicator settings, set the desired stochastic and ema values, and the stochastic condition you want to use to enter a trade.
In the indicator, set which exchange, symbol, and account to execute trades on.
In the indicator, set the PV Alert names you intend to use. If you want to use the same names as provided in the pastebin below, you may set the three names to Market Long, Market Short, TP SL Hit.
In PV, create two new PV Alerts in the PV Alert tab in accordance to these specifics pastebin.com .
On the Tradingview chart you want the indicator run on, create a new TV alert with this script as its condition, and specify the alert to "alert() function calls only".
DCA Bot for ProfitViewThe base for this strategy is the "Backtesting 3commas DCA Bot v2" script by rouxam. I have made some additions, edits, and fixes, as well as tailored it for usage with ProfitView.
The strategy works in such a way that you select one or multiple rules together, in order to determine when a trade should be initiated.
The selectable rules are:
RSI-7: Initiate trading when the 7 period RSI goes below a specified threshold.
Technicals: This is essentially the TradingView screener strength. A multitude of technical indicators combined that range from Strong Sell - Sell - Buy - Strong Buy.
QFL: Find a support/resistance line on a specified timeframe, and initiate trading only when the price is below a certain point from this line.
Once the deal start rule is met, trading will initiate, and a series of additional orders will be placed and spaced out according to the order settings set in the indicator. These orders includes Take Profit, Stoploss, Trailing Take Profit, and specified additional entry orders to DCA your way into a position.
The indicator is set up so that by hooking this up to ProfitView, all of the signals should automatically be replicated to your assigned exchange, along with discord/telegram notifications for when the deals start and end, and the resulting pnl.
If you want to use it for spot markets, while technically possible, you will need to significantly edit the PV Alert syntax that i have supplied below.
Run this on your testnet of choice, it is likely that there are undiscovered issues at this point.
The strategy currently only works with 'Longs' at the time of publishing, but may be subject to change.
==ProfitView Setup==
!!Important!!
The assigned PV Alert name must contain the keyword 'Long', fex "DCA Long"
Uncheck the Once per Bar advanced filter option on the PV Alert you use for this.
Copy/Paste the text into the PV Alert: pastebin.com

Bounce Manager 20 TrendlinesThe trendline script is made for manual input of trendlines using point clicks on the chart. The script will then see if price respects these lines by the parameters you input in settings panel. On a respectable bounce it will print buy/sell arrows. The script also has functionality to send alerts, this is helpful if you want to automate trendlines. I created this script and many others under the bounce manager toolkit to expand on the signalling capabilities of popular drawing tools as I find using just a crossover to be lacking especialy for full automation.
components:
- Line respect: When price moves past this the script will no longer look for entry until a new trend has been established. The line can also be used as a stop loss.
- Confirmation: When price touches the line during a trend it
will wait to cross over this line to confirm a reaction from the line.
- Consolidation filter: A trend filtering system, this is a distance from
the line price has to break to confirm trend direction.
- Stop loss: This can be set to a percentage distance from the low after
bounce. Or it can be set to the line respect line
- Take profit: This can be a fixed take profit target or a risk to reward
based take profit. With risk to reward it will multiply the stop loss
distance by the input and use that to create target (green cross)
- ATR based or % based: there are 2 versions of the script, one for strict
percentage based logic and another one based on ATR values
If you are having problems figuring out which settings to use I recommend you check the Bounce Manager ATR script for reference as this script plots the components:
Zignaly automation settings:
zignaly integration, you can use the settings panel to decide your risk management. Option to use a fixed take profit % or an automatic risk to reward calculation based on the stop loss. Stop loss can get calculated using the max violation setting as a stop loss (this will put stop loss below line respect level) or when not checked it will use 0.01% below the low of the signal candle as stop loss. Just add your zignaly private key in the settings and use any alert function call as alert. Make sure to use zignaly.com as your webhook url.
The trendlines you see in preview are based on a long term pitchfork on BTCUSDT 10H chart
If 20 trendlines are too much I will be releasing a 5 line input version, this script is more to be used to automate pitchforks, gann boxes etc.
Part of the Honest Algo indicator suite

EasyTrade - Chandelier EMAHello Traders!
Starting from an idea of youtube channel "Ultra Trader", we have developed this simple indicator and prepared to be used with EasyTrade software.
You can setup Alerts for Crypto or Forex/Indices/Stocks/etc...
The simple but working idea behind this indicator, is a combination of "Chandelier Exit strategy" and EMA 200. It's great on long trend.
Good results are obtained with scalping timeframe from 1 to 15-minute timeframe (see video for details).
Settings
ATR Period : This value is used to change the number of candles used in ATR formula.
ATR Multiplier : This value is used to multiply the ATR value.
Use EMA filter and Value : This options Enable/Disable the EMA filter. You can change the period of the EMA
R/R ratio : You can set your Risk/Reward ratio according to your trading rules.
Show Trend : Show or hide the indicator cloud
Show Signals : Show or hide the dots on the bottom of the graphs and the "Sell" or "Buy" labels.
Show TP/SL : Show or hide Take profits (Purple line) and Stop Loss (Orange Line)
Alerts
The alert signal generated by the indicator can be directly used by the EasyTrade software to directly execute trades on your preferred Broker.
Conclusion
We hope it will be useful to simplify and automate your trading, but remember; always do your back-tests with your trading rules .
Suggestions or improvements are always welcome, if they make sense.
Credits
Ultra Trades Video
EasyTrade Free Indicators and Software

SuperTrend Multiple Risk Management SystemThis is an improved SuperTrend strategy that makes use of multiple types of risk management options.
We have for example :
1. Take profit and stop loss levels based on support and resistence created with RSI and Pivot Lines(dynamic)
For example, if we have an oversold level and a pivot low , we can take that low point for support.(or resistence for short)
If instead we have an overbought level and a pivot high, we can take that high point for resistence.(orsupport for short)
2. Take profit and stop loss levels based on swing low and swing high points calculated with highest high and lowest low function(dynamic)
For example we take the lowest point in the last 100 candles. We calculate the distance from the current point to that one, and we apply this value as a take profit point. Same for stop loss
3. Take profit and stop loss levels based on % movements(fixed)
For example we have a tp or sl of 10%. If either of them make a movement of 10% from the entry point, they will get triggered.
4. Break even stop loss once the asset moves certain % in our direction.
For example we have a long breakeven of 5%. If the asset moves 5% in our direction, we move the stop loss on the entry point so if the trade pullback and crosses with this point it will exit from the trade.
Notes:
All the exits from the strategy are happening at the end of the candle close, since we are checking if inside the current candle we cross with either high or low of the candles parts the set prices from any of the above options.
At the same time we can combine multiple of them into one, and we can either exit based on which one was hit first, or use a quantity reduction of the trade and exit multiple times when we hit any of the levels.
This tool is for educational purpose only.
Its main purpose is to show the difference between having a risk management or without.
For example on this scenario of BTC USD 4h, I found out that the drawdawn was reduced by more than half when using different type of risk management, compared to not use one at all, while at the same time increasing the profits by a huge margin.

RSI Rising Crypto Trending StrategyThis is crypto and stock market trending strategy designed for long timeframes such as 4h+
From my tests it looks like it works better to trade crypto against crypto than trading against fiat.
Indicators used:
RSI for rising/falling of the trend
BB sidemarket
ROC sidemarket
Rules for entry
For long: RSI values are rising, and bb and roc tells us we are not in a sidemarket
For long: RSI values are falling, and bb and roc tells us we are not in a sidemarket
Rules for exit
We exit when we receive an opposite direction.
Cuation: Because this strategy uses no risk management, I recommend you takje care with it.
If you have any questions, let me know !

Crypto Scalper Divergence Macd Psar Ema 200This is a very efficient crypto scalper adapted to very short timeframes, however it can be optimized for other timeframes and assests as well.
Its components are
MACD
P SAR
EMA 200
Risk management
Rules for entry:
For short : we have an uptrend on PSAR , histogram is positive (divergence MACD) and close of a candle is below EMA 200
For long : we dont have an uptrend on PSAR, histogram is negative(divergence MACD) and close of a candle is above EMA 200
Rules for exit:
We exit when we either find a reverse condition than the entry one, or based on stop loss/take profit that are calculated on % movements of the price.
If you have any questions, let me know !

High/Low Channel Multi averages Crypto Swing strategyThis is a swing strategy designed for trending markets such as crypto and stock, with big timeframes , like 8h.
For this strategy we take SMA, EMA, VWMA, ALMA, SMMA, LSMA and VWMA and make an apply them all to both HIGH and LOW separately and make 2 averages, 1 applied to high and the other applied to low.
With them we make a channel.
Rules for entry
For long: close of a candle is above avg applied to high.
For short: close of a candle is below avg applied to low.
Rules for exit
We exit when we either hit TP or SL or when we receive a different condition than the entry one.(long- > short and viceversa)
If you have any questions, let me know !

3 RSI 6sma/ema ribbon crypto strategyThis is a very efficient swing trading strategy designed for crypto long timeframes like 2h+.
Initially we have 3 RSI .
AFter that we use them as source for 6 SMA/EMA for each RSI, 5, 30, 50, 70, 90, 100. With those we create a ribbon that we are going to use in order to check the direction of the trend.
Rules for entry:
For long : if either all the SMA/EMA's from the 2nd RSI are telling us to go long, or all the all SMA/EMA's from the 3rd rsi are telling us to go long F
For short : if either all the SMA/EMA's from the 2nd RSI are telling us to go short, or all the all SMA/EMA's from the 3rd rsi are telling us to go short
We exit when we get an opposite condition than the entry one.
Caution: this strategy has no risk management inside, so use it with caution. If you have any questions , let me know !

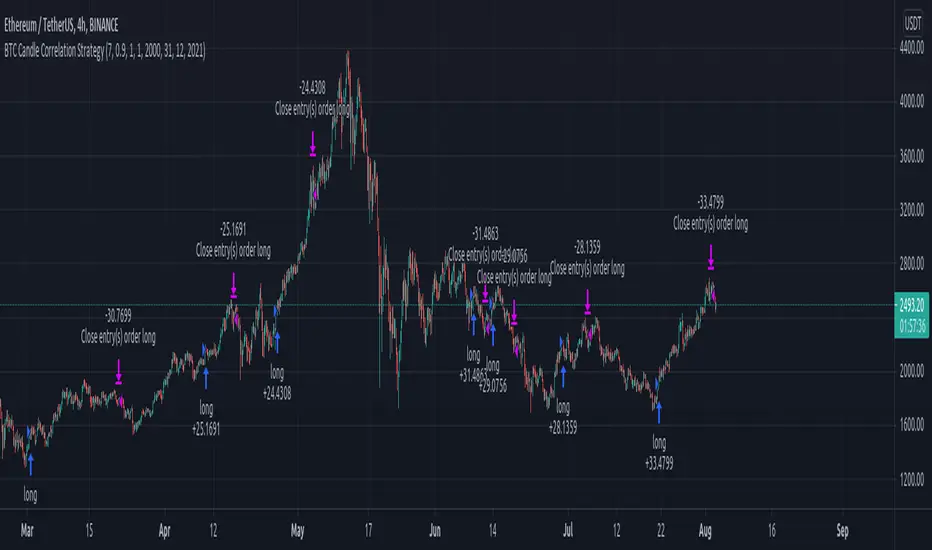
BTC Candle Correlation Strategy This is a special strategy adapted for crypto market, which instead of using the current chart candles, we use inside calculation a candle from different charts.
For best usage I recommend a big timeframe like 1-4h+.
In this case we take the high, low, open and close candles from different brokers for BTC, and with it we form up the candle that we are going to use for the logic of entry.
At the same time we are going to create an upper and lower bands using a moving average and the difference between high and low.
So in a way to put it, if BTC triggers a sell or buy order, we input instead these orders on the current chart, like in this example with ETH.
Rules for entry
For long : if we have a crossover of the btc source value with the upper band .
For short: if we have a crossunder of the btc source vale with the lower band.
For exit, we do it when we receive a different signal than the initial one.
This strategy does not have any other risk management inside, so use it with caution.
If you have any other questions, let me know !
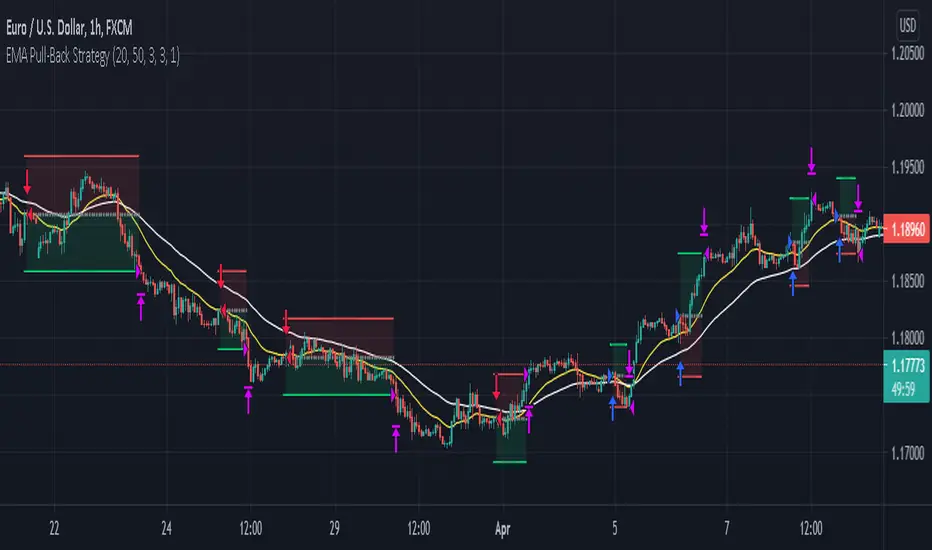
Scalp - 50/200 EMAWorks on any timeframe but was built originally for scalping. Uses 50EMA and 200EMA to define the trend and touch backs on to the 50 EMA for entry.
200 EMA - White Line
50 EMA - Yellow Line
ATR: Length 14 Smoothing RMA
1. Wait for 50ema to crossover 200 ema – Then wait for candle to touch 50 ema after the cross.
2. Entry: Green candle that closes above 50 ema without getting more than 3 candles closing below(BUY) or above (SELL) 50ema.
3. Stop loss: 2x ATR value below entry candle.
4. Take profit: 1.5x the risk.
Settings allow for # of Entries allowed per trend as well as EMA periods.
Opposite for Sell Entries (Stop Loss: 2x ATR value above entry candle)
Companion::InsurgentCompanion::Insurgent is a combined indicators strategy. Performances are pretty good on 1D, 4H and 1H timeframes and it can be used on Bitcoin and Altcoin markets.
Mainly, it is a trategy based on Ehlers formulas.
Used indicators:
- Ehlers Instantaneous Trend: trendline analysis;
- Ehlers Super Bandpass Filter: momentum detection;
- EMA: Long/Short time selector.
What the script does:
- determines trendlines combining mulitple indicators;
- automaticlally calculates Take profit and Stop Loss levels;
- permits automation generating Autoview signals (create an alert with {{strategy.order.alert_message}} in message text field to trap Autoview commands;
- supports for margin trading. Spot trading will be added in the future.
BACKTESTING
Backtest is not leveraged. Defaults are set as follow:
Capital: 10000
Percent of equity used for trades: 10%
Commission: 0.18% this is Bitfinex commission on orders
Change them accordingly on how you trade to get a more realistic backtest results.

Compact Self-Adjusting Parabolic SARA custom version of the Self-Adjusting Parabolic SAR that can be used as a source for your trading frameworks and indicators.
It is presented on the preview as a -signal line that replicates Self-Adjusting Parabolic SAR state.
Here is an example of how it works with Buy/Sell/TP/SL/TSL Alerts Module :
If you have any questions don't hesitate to ask and contact me either via private messages on TradingView or via Telegram.
