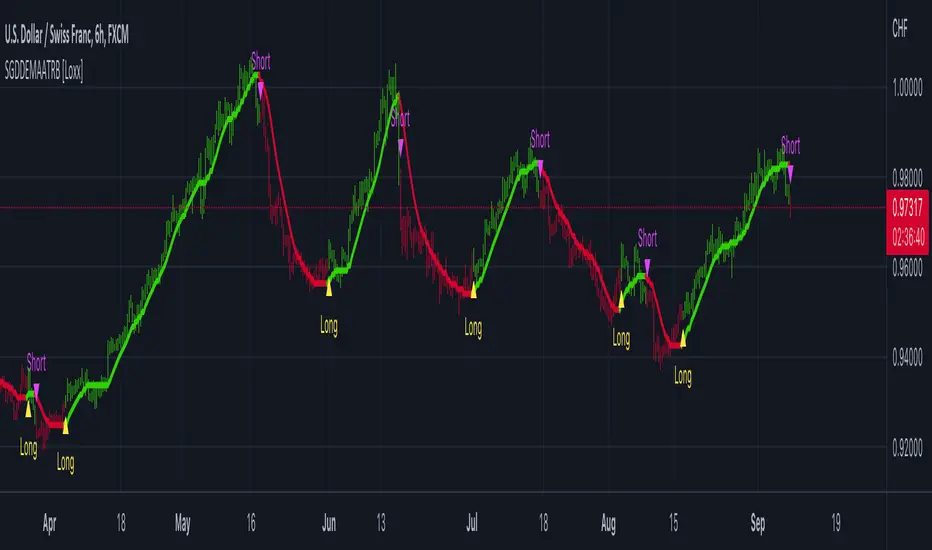
Step Generalized Double DEMA (ATR based) [Loxx]Step Generalized Double DEMA (ATR based) works like a T3 moving average but is less smooth. This is on purpose to catch more signals. The addition of ATR stepped filtering reduces noise while maintaining signal integrity. This one comes via Mr. Tools.
Theory:
The double exponential moving average (DEMA), was developed by Patrick Mulloy in an attempt to reduce the amount of lag time found in traditional moving averages. It was first introduced in the February 1994 issue of the magazine Technical Analysis of Stocks & Commodities in Mulloy's article "Smoothing Data with Faster Moving Averages". The way to calculate is the following :
The Double Exponential Moving Average calculations are based combinations of a single EMA and double EMA into a new EMA:
1. Calculate EMA
2. Calculate Smoothed EMA by applying EMA with the same period to the EMA calculated in the first step
3. Calculate DEMA
DEMA = (2 * EMA) - (Smoothed EMA)
This version:
For our purposes here, we are using Tim Tillson's (the inventor of T3) work, specifically, we are using the GDEMA of GDEMA for calculation (which is the "middle step" of T3 calculation). Since there are no versions showing that "middle step, this version covers that too. The result is smoother than Generalized DEMA, but is less smooth than T3 - one has to do some experimenting in order to find the optimal way to use it, but in any case, since it is "faster" than the T3 (Tim Tillson T3) and still smooth, it looks like a good compromise between speed and smoothness.
Usage:
You can use it as any regular average or you can use the color change of the indicator as a signal.
Included
Alerts
Signals
Bar coloring
Loxx's Expanded Source Types
ATR
TTP Kent StratKent Strat trades breakouts using Bollinger Bands together with SuperTrend.
Features:
- Risk/reward ratio parameter
- Longs, shorts and combined positions.
- Breakout settings
- Trailing SL, trailing TP
- Use of latest candles to place the SL using a lookback parameter (how many candles to look back for a low/high price)
- Select your SL between the ATR trendline and the latest candle: the closest or furthest away value
- Show the trendline
- Backtest mode for accurate backtests
- Signal mode for live price accurate signals
- Date range backtesting
Filters:
- EMA 200 filter and timeframe selector. This filter can be used to trade with the trend: open longs on an uptrend and shorts on a downtrend.
- ADX filter using threshold. This filter can be used to filter entries where the trend is not very strong.
- ADX pointing up. ADX values pointing up and above certain threshold can improve entries.
- Relative volume filter based on the volume being X% above the MA of the Volume. Trading with volume can help filtering out bad trades.
Example setup:
1) pick BINANCE:ETHUSDT chart, 15 min chart
2) trade longs + shorts
3) pick ratio 3
4) trailing SL checked
5) trailing TP unchecked
7) stop loss "furthest"
8) candle loopback 30
9) BB period 21, dev 1, ATR filter on, atr period 5
10) EMA filter on, 15 min
11) ADX off
12) Volume filter on set to 60%

Reversal MagictrendThis indicator combine multiple indicator in one pine script : Main indicator is Exponential Moving Average (EMA), Commodity Channel Index (CCI), Average True Range (ATR), Crossover Signal & Alert.
1)
For Exponential Moving Average (EMA) have 5 type :
EMA 7 : Green Color (Transparent)
EMA 21 : Red Color (Transparent)
EMA 34 : Orange Color (Faint)
EMA 50 : Purple Color (Transparent)
EMA 90 : Aqua Color (Faint)
Trendband / Background Color in between EMA line :
EMA 7 Cross up EMA 21 : Green
EMA 7 Cross down EMA 21 : Red
EMA 21 Cross up EMA : Yellow
Crossover Signal :
EMA 7 Cross up EMA 21 = Golden Cross : Blue Diamond
EMA 7 Cross down EMA 21 = Death Cross : Red Diamond
Example :
2)
Commodity Channel Index (CCI) :
Have background color : Green for positive value
CCI Signal = Anchor / Hook
- As a signal of reversal. Strong reversal when appear on weekly chart
Example :
Weekly :
Daily :
I am inspired from : www.tradingview.com
Check out his indicator here :
3)
Average True Range (ATR) as Supertrend
Green (Start) New Start for uptrend
Red (End) New Start for downtrend
Also Add on value for each signal.
Example :
I am inspired from : www.tradingview.com
Check out his Supertrend here :
4)
For this indicator, user have option to turn on / off :
- Previous Signal as a backtest
- Previous Trend as a backtest
- ATR to make chart more clean.

Damiani Volatmeter [loxx]I wasn't going to publish this since it's one my go to private indicators, but I decided to push this out anyway. This is a variation on Damiani Volatmeter to make it easier to understand what's going on. Damiani Volatmeter uses ATR and Standard deviation to tease out ticker volatility so you can better understand when it's the ideal time to trade. The idea here is that you only take trades when volatility is high so this indicator is to be coupled with various other indicators to validate the other indicator's signals. This is also useful for detecting crabbing and chopping markets.
Shoutout to user @xinolia for the DV function used here.
Anything red means that volatility is low. Remember volatility doesn't have a direction. Anything green means volatility high despite the direction of price. The core signal line here is the green and red line that dips below two while threshold lines to "recharge". Maximum recharge happen when the core signal line shows a yellow ping. Soon after one or many yellow pings you should expect a massive upthrust of volatility. The idea here is you don't trade unless volatility is rising or green. This means that the Volatmeter has to dip into the recharge zone, recharge and then spike upward. You can also attempt to buy or sell reversals with confluence indicators when volatility is in the recharge zone, but I wouldn't recommend this. However, if you so choose to do this, then use the following indicator for confluence.
And last reminder, volatility doesn't have a direction ! Red doesn't mean short, and green doesn't mean long, Red means don't trade period regardless of direction long/short, and green means trade no matter the direction long/short. This means you'll have to add an indicator that does show direction such as a mean reversion indicator like Fisher Transform or a Gaussian Filter. You can search my public scripts for various Fisher Transform and Gaussian Filter indicators.
Price-Filtered Spearman Rank Correl. w/ Floating Levels is considered the Mercedes Benz of reversal indcators
How signals work
RV = Rising Volatility
VD = Volatility Dump
Plots
White line is signal
Thick red/green line is the Volatmeter line
The dotted lower lines are the zero line and minimum recharging line
Included
Bar coloring
Alerts
Signals
Related indicators
Variety Moving Average Waddah Attar Explosion (WAE)

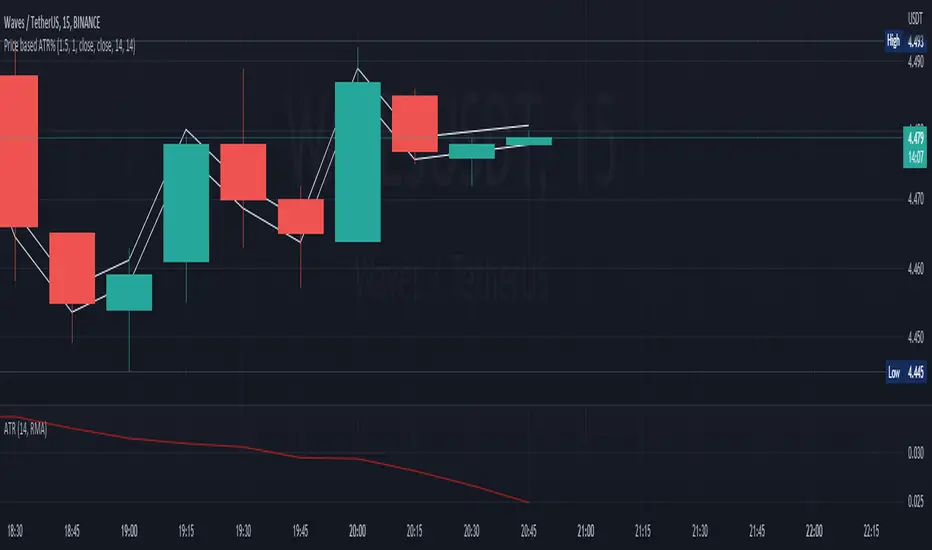
Price based ATR%This script shows upto two lines that represent a deviation from the price based on a multiple of the ATR%
close + ( (close / 100) * ( atr * upperMultiplier) )
and
close - ( (close / 100) * ( atr * lowerMultiplier) )
Zero-line Volatility Quality Index (VQI) [Loxx]Originally volatility quality was invented by Thomas Stridsman, and he uses it in combination of two averages.
This version:
This doesn't use averages for trend estimation, but instead uses the slope of the Volatility quality. In order to lessen the number of signals (which can be enormous if the VQ is not filtered), some versions similar to this are using pips filters. This version is using % ATR (Average True Range) instead. The reason for that is that :
Using fixed pips value as a filter will work on one symbol and will not work on another
Changing time frames will render the filter worthless since the ranges of higher time frames are much greater than those at lower time frames, and, when you set your filter on one time frame and then try it on another, it is almost certain that it will have to be adjusted again
Additionally, this version is made to oscillate around zero line (which makes the potential levels, which are even in the original Stridsman's version doubtful, unnecessary)
Usage:
You can use the color change as signals when using this indicator
QG-Trend Pullback StrategyI wanted to test the pullback strategy shown by TradePro and 5 minute scalping channels on the YT.
So here it is, worked on USDCHF pair best and not so much on other forex pairs on 15 min or 5 min charts as shown in strategy.
Entry rules for Long:
Price above EMA200 or G channel as trend filter
Donchian trend ribbon in retracement or red in color
Wavetrend cross below a threshold level below zeroline.
Opposite rules for Shorts.
The SL and TP based on the ATR multiplier and a TP as RR ratio to SL.
Attaching the equity curve on USDCHF 15 min chart where it worked best.
Cumulative ATR Distance Oscillator// A Price/ATR oscillator with cumulative waves.
// Based on Cumulative Volume Delta, but using price movement alone.
// Public Domain
// By Jolly Wizard
ATR VS TRUE RANGEDisplays ATR and True Range on the same panel.
Adjust the input and style settings to your liking.

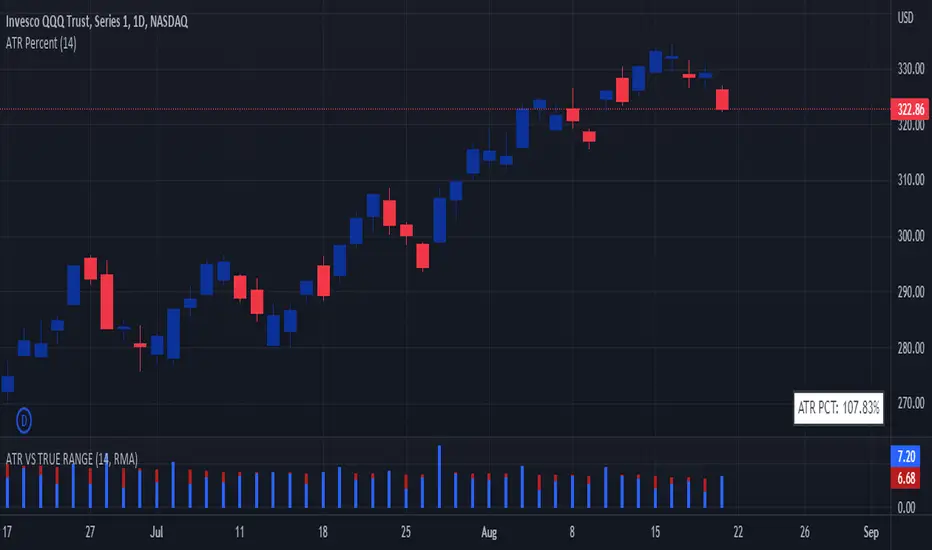
ATR PercentDisplays daily percentage on the bottom right corner of chart.
Formula:
True Range / ATR * 100
Ichimoku ATR Oscillator// An oscillator that visualizes Ichimoku trend line distances in terms of ATR.
// Public Domain
// By JollyWizard

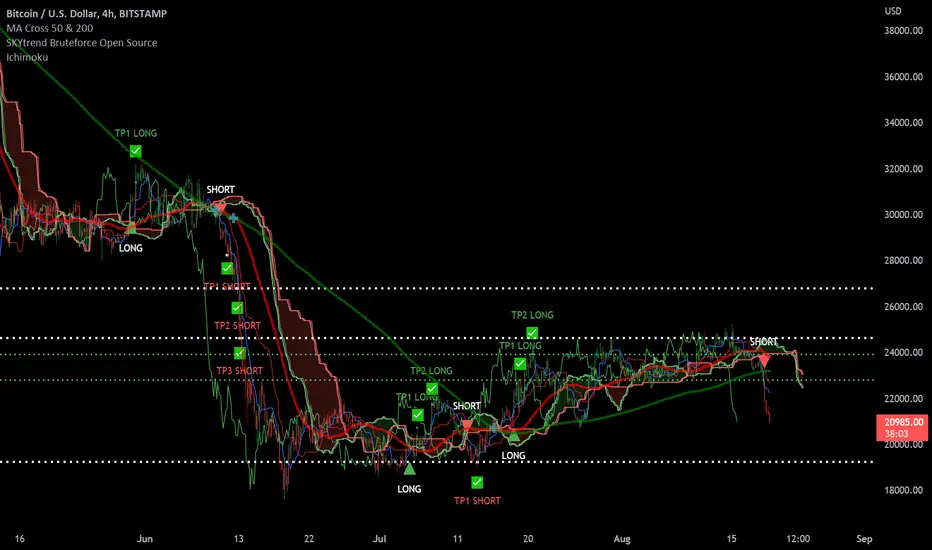
SKYtrend Bruteforce Open Source✨SKYtrend Bruteforce Now Open Source✨
📌This indicator analyzes the trend and calls Long/Short which is fully custom to fit your style of trading.
📌Custom Take Profit Levels currently have 3 TP levels for Long and Short you can decide which % each TP will be in settings.
📌2 Custom Stoploss levels. For Long or Short. Can Enable or Disable either.
📌Can set alert For Long, Short , TP Long 1-3, TP Short 1-3, SL 1-2
📌Has built in ichimoku cloud
If you like it, like it. :)
KTP ATR , TR and DATR by Mitraj ThakkarThis indicator provides values of ATR, TR and DATR values side by side which makes it easy for user to compare it for current
candle and takes decision. It is not a complete system for trading but it aids in taking decision for entry and exit. for eg. ema crossover is formed for entry, we can take entry 5% of datr above pattern and keep stop loss 10% datr below pattern.
ATR stands for Average true range of last 14 candles.
TR stands for true range of each candle.
DATR stands for Daily Average True Range.

Daily/Weekly ExtremesBACKGROUND
This indicator calculates the daily and weekly +-1 standard deviation of the S&P 500 based on 2 methodologies:
1. VIX - Using the market's expectation of forward volatility, one can calculate the daily expectation by dividing the VIX by the square root of 252 (the number of trading days in a year) - also know as the "rule of 16." Similarly, dividing by the square root of 50 will give you the weekly expected range based on the VIX.
2. ATR - We also provide expected weekly and daily ranges based on 5 day/week ATR.
HOW TO USE
- This indicator only has 1 option in the settings: choosing the ATR (default) or the VIX to plot the +-1 standard deviation range.
- This indicator WILL ONLY display these ranges if you are looking at the SPX or ES futures. The ranges will not be displayed if you are looking at any other symbols
- The boundaries displayed on the chart should not be used on their own as bounce/reject levels. They are simply to provide a frame of reference as to where price is trading with respect to the market's implied expectations. It can be used as an indicator to look for signs of reversals on the tape.
- Daily and Weekly extremes are plotted on all time frames (even on lower time frames).

3c Ultimate reversal strategy With scanner and backtester v2This might just be the ultimate strategy to identify reversals.
This strategy includes a scanner, a backtester and ability to connect it with you 3 commas bot(See adviced settings below)
Strategy:
-Signals reversal that happened in the last bar. This signal DO NOT repaint.
-Identifies potential reversal that might happen in the current bar but can also not happen depending upon the timeframe closing price.
-The strategy combines the Moving Average Trend Changer, SuperTrend (ATR price detection) and ADX.
-It reduces the number of false signals in sideways market conditons and give more reliable trade signals.
-The signal does not repaint and can be used in any market condition. It determines the trend with high precision.
Take profit:
-Set 2 separate TP conditions.
-You can take profit using percentage, ATR, or RR(Risk Reward), aswell as using Trailing Take Profit.
- Use sell signal from the strategy(I often find way better results using that)
Stoploss:
-You can use either ATR, Percentage or sell signal from the strategy
(For now to let the strategy itself decide when to TP or SL, just set these parameters really high.)
Scanner:
-Identifies coins that are currently in the sell zone
-Identifies coins that are currently in the buy zone
-Screener explores up to 20 pairs in current graph's time frame.
-Optimize the strategy to your liking and use the built in backtester to see if it is a viable strategy.
3commas settings:
-For now you can only use simple bots.
-Create LONG and SHORT bots for the coins you like to trade and set up alerts(You can send long and short signal from the same alert)
-Set TP to 50% the strategy will handle buys and exits based on your inputs.
-Set safety orders to 0. I might add DCA to the strategy if testing proves that to be a good solution.
-When you have made the bots input the bot ID and token adress in the settings of the strategy.
-When creating the alert use this webhook :https://3commas.io/trade_signal/trading_view
-In the message field you use {{strategy.order.alert_message}} as the placeholder.
In the future this signal might make it to the 3commas marketplace. You can then subscribe to that signal where I have cherrypicked coins based on thorough backtesting and optimization.

Swing Trend StrategyThis script is a trend following system which uses a long term Moving Average to spot the trend in combination with the Average True Range to filter out Fakeouts, limiting the overall drawdown.
Default Settings and Calculation:
- The trend is detected using the Exponential Moving Average on 200 periods.
- The Average True Range is calculated on 10 periods.
- The Market is considered in an Uptrend when the price closes above the EMA + ATR.
- The Market is considered in a Downtrend when the price closes below the EMA - ATR.
- The strategy will open a LONG position when the market is in an Uptrend.
- The strategy will close its LONG positions when the price closes below the EMA.
- The strategy will open a SHORT position when the market is in a Downtrend.
- The strategy will close its SHORT positions when the price closes above the EMA.
This script is best suited for the 4h timeframe, and shows good results on BTC and ETH especially.
The options allow to modify the type of moving average to use, the period of the moving average, the ATR multiplier to add as well as the possibility to open short trades or not.

ATR-FXV2Indicator Name : ATR-FXV2
Features :
This indicator will allow the user to read current and previous day ATR values with Multiple time frame. Using yesterday 1 hour high ATR value this system will auto plot the support and resistance and same will be maintained in all the time frames. Option has been provide to create 2 EMA lines and it is optional.
This indicator will work in all the currencies, commodity and crypto.
supports both continues and time based market.
user has option to update ATR and EMA values which will help the user to do back test this strategy.
Technical:
current day standard time frame ATR values has been displayed in the right corner table.
Box size has been displayed in the right coroner table.
open time has been plotted with different color.
All the support lines has been plotter with same color.
All the resistance lines has been plotted with same color.
suggested EMA has been displayed in right corner table.
Note: before using this system kindly do the back testing.

ER-Adaptive ATR [Loxx]Average True Range (ATR) is widely used indicator in many occasions for technical analysis. It is calculated as the RMA of true range. This version adds a "twist": it uses Perry Kaufman's Efficiency Ratio to calculate adaptive true range
You can use this indicator the same way you'd use the standard ATR.

Strategy Myth-Busting #1 - UT Bot+STC+Hull [MYN]This is part of a new series we are calling "Strategy Myth-Busting" where we take open public manual trading strategies and automate them. The goal is to not only validate the authenticity of the claims but to provide an automated version for traders who wish to trade autonomously.
Our first one is an automated version of the " The ULTIMATE Scalping Trading Strategy for 2022 " strategy from " My Trading Journey " who claims to have achieved not only profits but a 98.3% win rate. As you can see from the backtest results below, I was unable to substantiate anything close to that that claim on the same symbol (NVDA), timeframe (5m) with identical instrument settings that " My Trading Journey " was demonstrating with. Strategy Busted.
If you know of or have a strategy you want to see myth-busted or just have an idea for one, please feel free to message me.
This strategy uses a combination of 3 open-source public indicators:
UT Bot Alerts by QuantNomad
STC Indicator - A Better MACD By shayankm
Basic Hull Ma Pack tinkered by InSilico
Trading Rules:
5 min candles
Long
New Buy Signal from UT Bot Alerts Strategy
STC is green and below 25 and rising
Hull Suite is green
Short
New Sell Signal from UT Bot Alerts Strategy
STC is red and above 75 and falling
Hull Suite is red

ATR-Adaptive JMA [Loxx]Not many know that the JMA (Jurik Moving Average) is already an adaptive indicator (it is adapting using the usual market volatility monitoring mode). Hence, making it adaptive "once more" makes it double adaptive. Fro the adaptivity in this case, we are use ATR (Average True Range) to make the JMA double adaptive. The ATR period is the same as the JMA period (there is no separate setting for that) so the usage of the indicator is as simple as it gets.
What is Jurik Volty used in the Juirk Filter?
One of the lesser known qualities of Juirk smoothing is that the Jurik smoothing process is adaptive. "Jurik Volty" (a sort of market volatility ) is what makes Jurik smoothing adaptive. The Jurik Volty calculation can be used as both a standalone indicator and to smooth other indicators that you wish to make adaptive.
What is the Jurik Moving Average?
Have you noticed how moving averages add some lag (delay) to your signals? ... especially when price gaps up or down in a big move, and you are waiting for your moving average to catch up? Wait no more! JMA eliminates this problem forever and gives you the best of both worlds: low lag and smooth lines.
Included:
Bar coloring
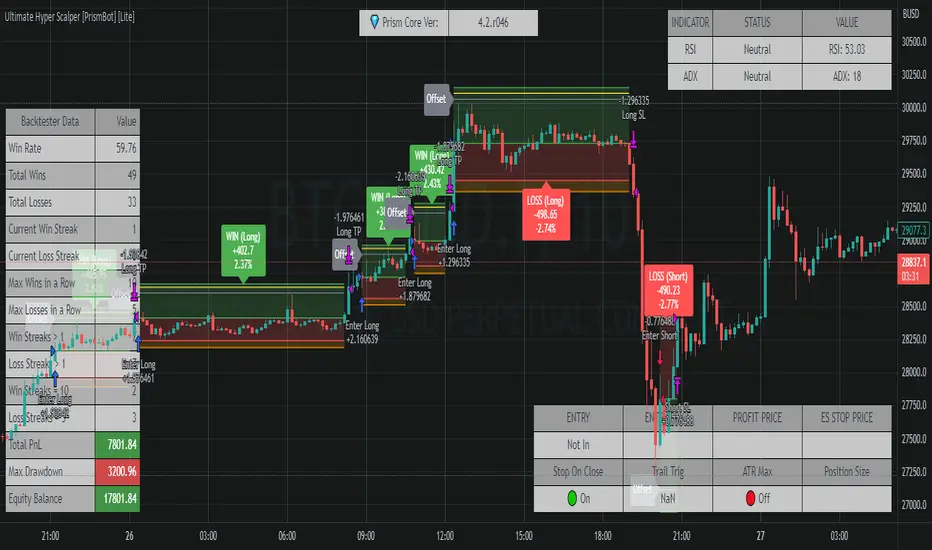
Ultimate Hyper Scalper Strategy [PrismBot] [Lite]💎 Prism Core Initial Release
ver 3.4.r379
This strategy is built on on a modified and reworked older version of the Waddah Attar Explosion strategy. It contains several confluence indicators such as Triple EMAs, volume, consolidation, ADX, and Bull Bear Power.
The Waddah Attar Indicator strategy is based on the following conditions:
LONG
trend is up
explosion line is greater than the dead zone line or a set threshold
SHORT
trend is down
explosion line is greater than the dead zone line or a set threshold
While this is a very simple strategy on the surface, the WAE indicator is great for finding strong trending markets and as it can be considered high frequency, can be paired with other confluence such as the ADX indicator to find high volatility movements.
This strategy also contains a myriad of custom order features, such as controlling the type of position sizes you open with Risk %, volatility, ATR based stops, and much more.
If you have any questions about this strategy or its features, you can ask in the comments below, or DM me here on Tradingview.
[MAD] almost Nadaraya-Watson EnvelopeThis is a cloud where I tried to recreate the Nadaraya-Watson Envelope using a different mathematical approach
Clustered standard Ma's with weighting.
Objectives:
No repaints
Alerts
Almost the same output on live play.... (no need to replay history when configuring settings).
the presetup is for LuxAlgo's default settings (thanks for this great indicator).
Features:
Alarms with different modes --- Band 3 is the band that triggers the alarms.
more gradual setting for the curve
visual alerts for band 1 and 2
how to use:
in trend direction act the yellow "in direction" arrows tape 1
against the trend direction: the band 3 signal, DCA or with SL, prefer SL as it is safer
for both trading variants you can adjust the curve and the bands to your risk management
have fun

3C Crossover with TTP & TSLThis is not a set and forget strategy. It needs constant tweaking to maintain a high winrate. Also what works on one pair can be horrible on another.
This strategy works best on the 1 min or 5 min TF but also works well on the 15 min. Haven't done any testing in higher TF's as im only interested in scalping.
If enabled you can retrive data for the filters on any TF.
The strategy do not repaint.
You do not need a 3c subscription to run this strategy as the bot turns on and off the bot itself.
Instructions for the 3commas connector:
1. First, you need to prepare 3commas Long/Short bots that will only listen to custom TV signals.
2. Inputs for the 3commas bot can be found at the end of the user inputs.
3. Once you have entered the required details into the inputs, turn on 3commas comments. They should appear on the chart (looks messy).
4. Now you can add the alert where you should paste the 3commas Webhook URL: 3commas.io
5. For the alert message text insert the placeholder {{strategy.order.comment}} and delete the rest. 6. Once the alert is saved, you can turn off those 3commas comments to have a clearer chart.
7. With a new alert, the bot and trade should launch.
Long or Short trades are determined with a crossing of the fast MA over the slow MA for Long and the opposite for Short. By checking Close position on MA cross the deal will close on a crossover/under of the 2 MA's
You can select from various different MA's and of course lenghts. You can add both EMA filter on any lenght aswell as ATR to determine to go long or short.
Using the MA gap can help you to not enter trades in a low volatile ranging market.
The RSI filter, sets the maximum RSI threshold for a long position and the minimum for a short. By default and what i recomend is that you enter Longs when RSI is above 50 and shorts when RSI are below 50.
-You can set confirmation of the trade direction with RSI , i.e. for Long the RSI must rise a specified number of bars back, vice versa for Short.
Enabling the pullback filter is great to avoid Longing tops and Shorting bottoms.
Stop loss can be set be either a fixed percentage or by using ATR
Take profit can be set by using percentage, ATR or RiskReward ratio(RR). if you use ATR as a stoploss i recomend using RR as the TP.
Yu can choose to trail the TP with either Percentage or ATR
Whats ahead. I really want to incorporate RSI divergencies, but haven't figured out how yet. Any other ideas would be greatly appreciated.
Have a look at my other strategies. They are similar to this but works abit differently.
