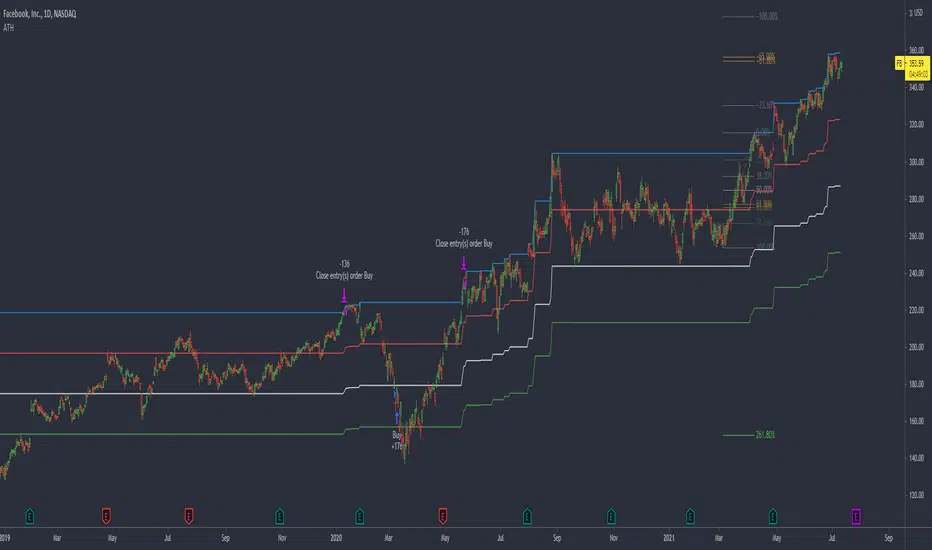
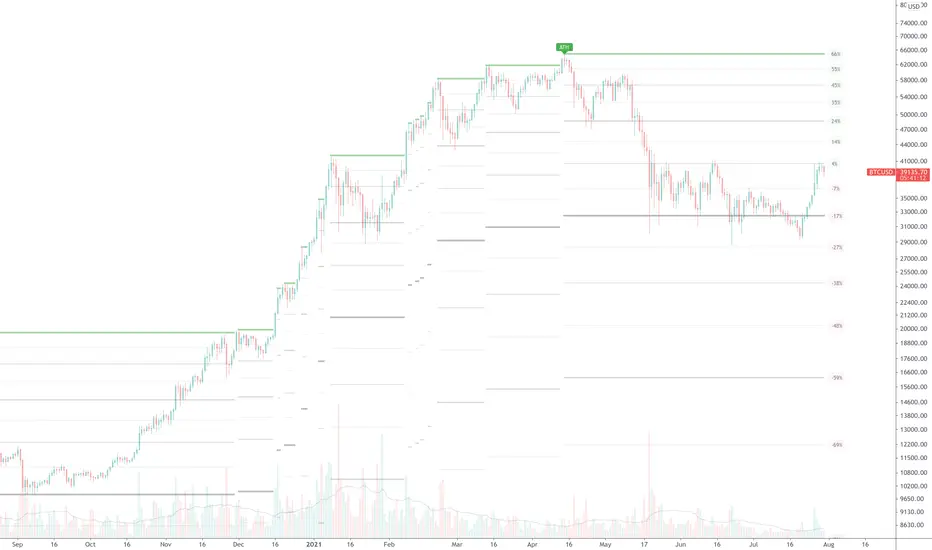
Buy From All Time HighThis strategy buys at a set percentage below the all time high and sells at the previous all time high.
ATH
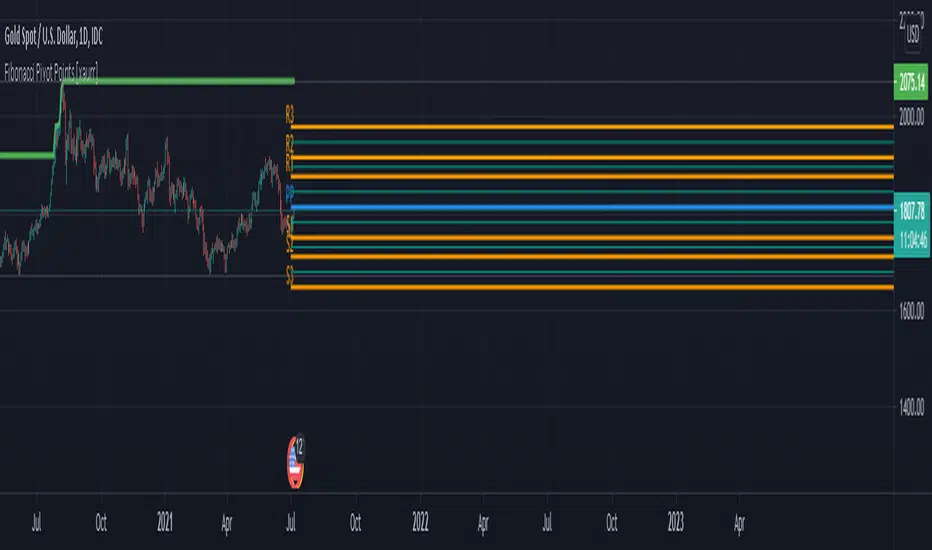
Fibonacci Pivot Points [xaurr]This script is the enhanced version of my previous script Ath Atl Fibonacci Pivot Points
It has standart fibonacci pivot points with auto time frame, you can also choose custom time frame too.
Good Luck!
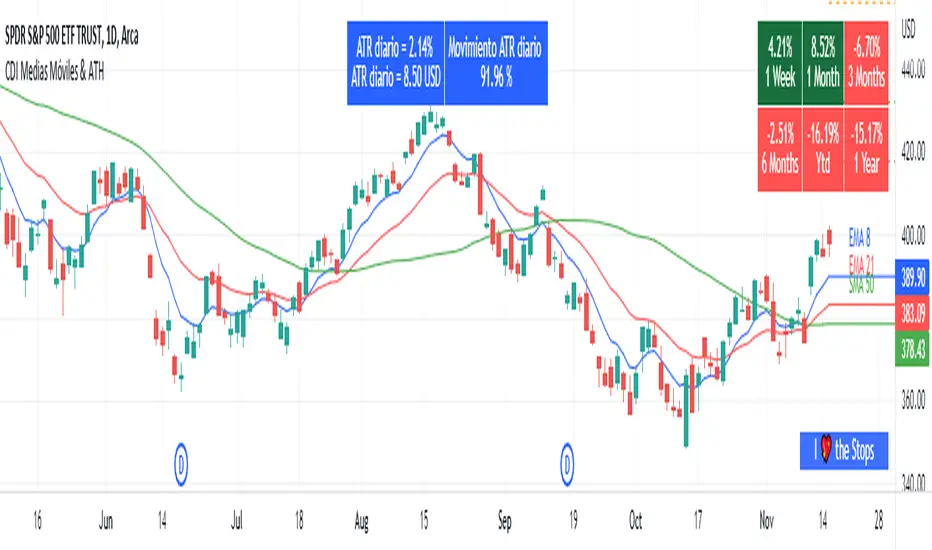
Moving Average and PerformanceThis indicator combines several tools that are used daily for analysis:
The performance of the action we are seeing.
The percentage of retracement the stock has made from its all time high.
Possibility of using up to four exponential or simple moving averages in the length we want.
It allows to see or not the levels of four moving averages in daily temporality.
This indicator is unique since it allows you to see in real time the performance of the Stock or ETF that is being analyzed, which allows you to make a timely decision for short, medium or long-term investments.
If you are doing scalping, swing, or intraday trading, you can see the retracement it has made from the ATH (3, 5, 10 or 13%) which can become Supports or Resistances where the price can rebound, Likewise, the levels of the moving averages in 1D temporality can be observed at the same time, which are usually dynamic supports or resistances and it can also be observed in the same temporality of the chart four moving averages that the trader can configure in the length that you deem convenient to improve your analysis and make decisions as quickly as possible.
Este indicador es único ya que permite ver en tiempo real el rendimiento de la Acción o ETF que se está analizando, lo cual permite tomar una decisión oportuna para las inversiones a corto, mediano o largo plazo.
Si se está haciendo trading tipo scalping, swing, o intradía, se puede observar el retroceso que ha hecho desde el ATH (3, 5, 10 o 13%) el cual puede convertirse en Soportes o Resistencias en donde el precio puede hacer rebotes, así mismo se pueden estar observando al mismo tiempo los niveles de las medias móviles en temporalidad de 1D, los cuales usualmente son Soportes o resistencias dinámicas y también se puede observar en la misma temporalidad del gráfico cuatro medias móviles que el trader puede configurar en la longitud que crea conveniente para mejorar su análisis y tomar decisiones lo más rápido posible.
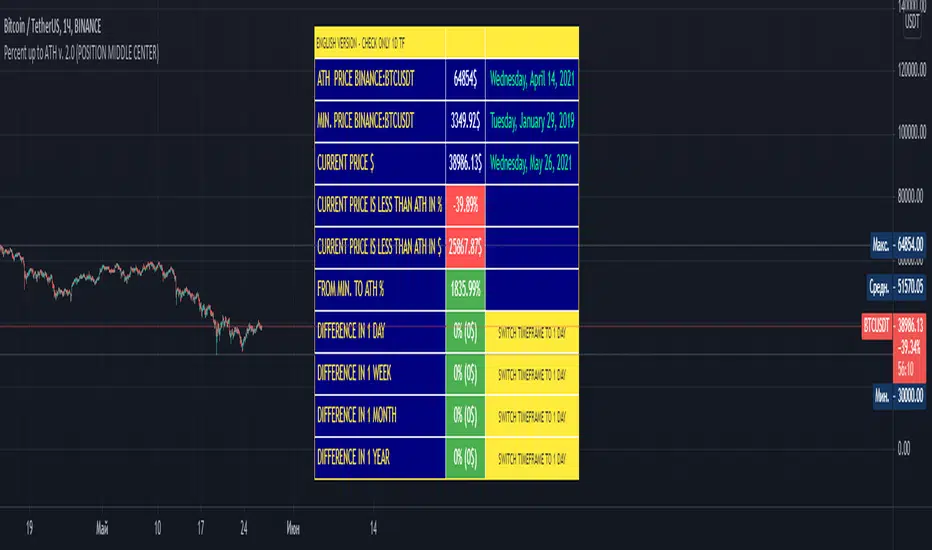
Percent up to ATH v. 2.0 (CHECK 1D TIMEFRAME)for the label to display the price change for 1 day, 1 week, 1 month and 1 year, you must switch the graph to the daily (1D) timeframe
this script shows:
- the maximum price and the date of this maximum
- the minimum price and date of this minimum
- current price and date of this price
- the difference between the current price and the maximum price in percent (%) and in dollars ($)
- the difference between the minimum price and the maximum price in percent (%) and in dollars ($)
- price change in percent and dollars for 1 day, 1 week, 1 month and 1 year
this script displays information in two languages - English and Russian
---------------------------------------------------------------------------------------------------------------------------------------------------------------------------------------------------------------
Чтобы на метке отображалось изменение цены за 1 день, 1 неделю, 1 месяц и 1 год, необходимо переключить график на дневной (1D) таймфрейм
этот скрипт показывает:
- максимальную цена и дату этого максимума
- минимальную цена и дату этого минимума
- текущую цена и дату этой цены
- разница между текущей ценой и максимальной ценой в процентах (%) и в долларах ($)
- разница между минимальной ценой и максимальной ценой в процентах (%) и в долларах ($)
- изменение цены в процентах и долларах за 1 день, 1 неделю, 1 месяц и 1 год
этот скрипт отображает информацию на двух языках - английском и русском.
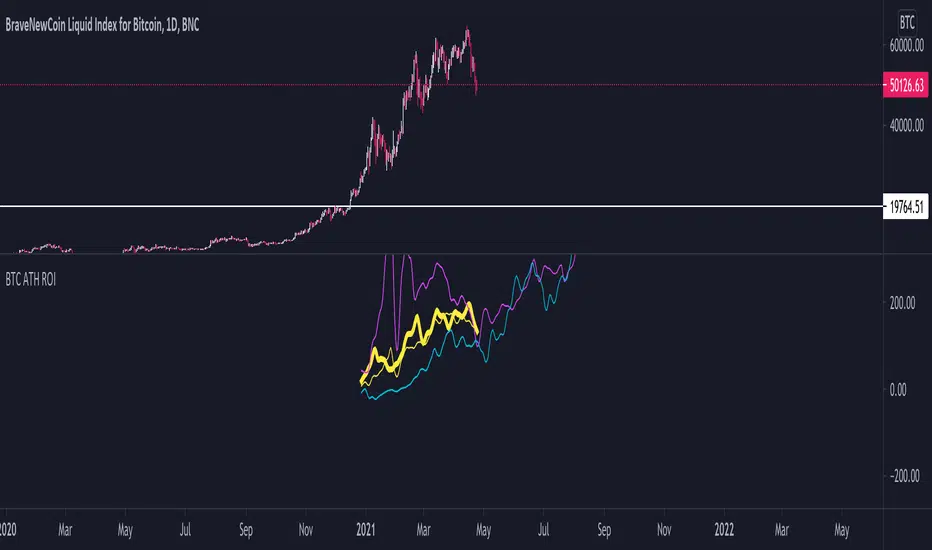
BTC ATH ROIThis indicator shows the ROI % of Bitcoin from when it passed its ATH of the previous bull cycle. I found it interesting that each time it crossed its ATH it took around 260-280 days to peak for each one. This bull run seems to follow between both of the previous bull runs including this recent dip.
There are a couple issues I want to fix but can't figure out:
1. You need to completely scroll out and move towards 2013 on the Daily chart for all 3 lines to show up. Would be nice to load all of that data at the start.
2. I can't query the value of the plots after they have been offset. This would be useful to create a prediction bias for the current plot so would could see where btc might go.
If you peeps know of a way to load all data or query plot values after offsets, please share. That would be awesome.
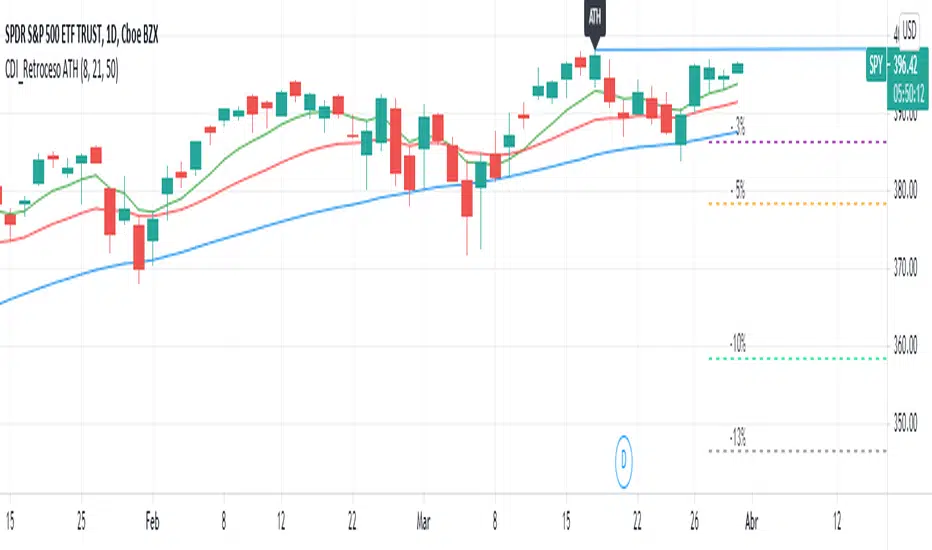
Retroceso 3%, 5%, 20% desde ATHThe Script shows us the% retracement that an action or ETF normally makes after it reaches its ATH, it also allows us to see the EMA 8, 21 and the MA 50 that show us the trend
El Script nos muestra el % de retroceso que normalmente hace una acción o ETF después que llega a su ATH, también nos permite ver las ver las EMA 8, 21 y la MA 50 que nos muestran la tendencia

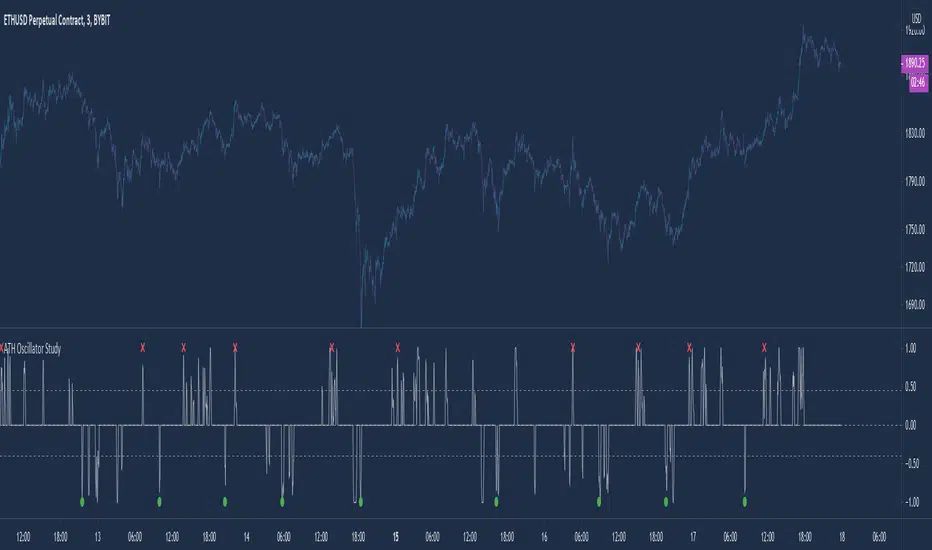
ATH Oscillator StudyThis idea stems from the belief that people want to reverse the trend when an all time high or low is hit. This strategy incorporates that by using ath and atl values based on the lookback period and the signal gets smoothed by the input smoothing type and length. I found that the best time to use this was on the 3m chart. But I am certain that higher time frames can be used if the settings are tweaked.
Settings:
Strategy -
simple(long,short,switch) - This strategy just uses the directional change of the signal using just longs, just short, or switching between the two.
range - This strategy uses the hlines on the chart to determine when to buy and sell. These can be adjusted using the Range Top / Bot values
div - This strategy uses a simple divergence of the signal line to time entries
Lookback - How many bars back to check the ath and atl
Smoothing - How smooth you want the signal
Smoothing Type - Different ways to smooth the signal
Range Top/Bot - Changes the height of the hlines for the range strategies
On Buy/Sell Signal # - Change when you enter. Increasing this number will move the signals to the left if there are consecutive signals. Useful to find bottoms and tops.
Chart: ETHUSD Perp Bybit
Notes: Use on 3-5m time frame for best results. Change settings if you want to try other coins like BTC or higher time frames
ATH Oscillator StrategyThis idea stems from the belief that people want to reverse the trend when an all time high or low is hit. This strategy incorporates that by using ath and atl values based on the lookback period and the signal gets smoothed by the input smoothing type and length. I found that the best time to use this was on the 3m chart. But I am certain that higher time frames can be used if the settings are tweaked.
Settings:
Strategy -
simple(long,short,switch) - This strategy just uses the directional change of the signal using just longs, just short, or switching between the two.
range - This strategy uses the hlines on the chart to determine when to buy and sell. These can be adjusted using the Range Top / Bot values
div - This strategy uses a simple divergence of the signal line to time entries
Lookback - How many bars back to check the ath and atl
Smoothing - How smooth you want the signal
Smoothing Type - Different ways to smooth the signal
Range Top/Bot - Changes the height of the hlines for the range strategies
On Buy/Sell Signal # - Change when you enter. Increasing this number will move the signals to the left if there are consecutive signals. Useful to find bottoms and tops.
Chart: ETHUSD Perp Bybit
Strategy Properties: 100 base order, 100% equity
Notes: Use on 3-5m time frame for best results. Change settings if you want to try other coins like BTC or higher time frames

Distance from the ATH priceThis indicator shows us the distance (in %) between the current price and the ATH price.
The closer the price is to the ATH the higher the percentage.
100% means we reached the ATH price.
HOW TO USE:
No special input necessary.
Markets:
It can be used to all markets.
NOTE:
Some Exchanges don't go very far back in the past and for this reason this may have impact on this Indicator.

ALL TIME HIGH/LOW AND 52 WEEKS HIGH/LOWThis script show:
1. All time high/low line shown in maroon color
2. 52weeks high/low line shown in red color
3. 25% below 52wh and 30% upper 52wl as per Mark Minervini suggset in his book "Trade Like a Stock Market Wizard: How to Achieve Super Performance in Stocks in Any
Market"
Thats all, hope benefit tou you all.
Thank you.

Better All time high & All time lowBetter & improved & simpler All time high (ATH) and All time low (ATL) indicator with custom bars length and enable/disable feature.

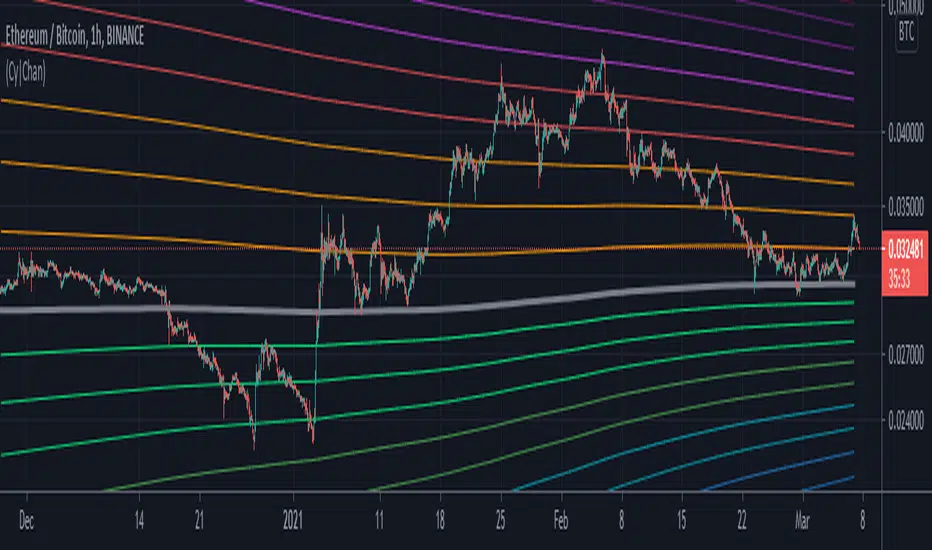
Cyber ChannelStandard deviation levels to determine if the price is over-extended in the positive/negative direction about the user defined MA line.
Historical confluence with the different levels can be used to estimate and predict the probability of a significant price retracement within given time-scale; and to help anticipate if the price is nearing local or all-time highs/lows.
True ATH/ATL w/ labelsPlots the All Time High and All Time Low, with optional labels when a new ATH/ATL is created. Reaches all the way back in history for the true high/low, not limited to the most recent 5000 candles like most scripts. Works on all time frames.
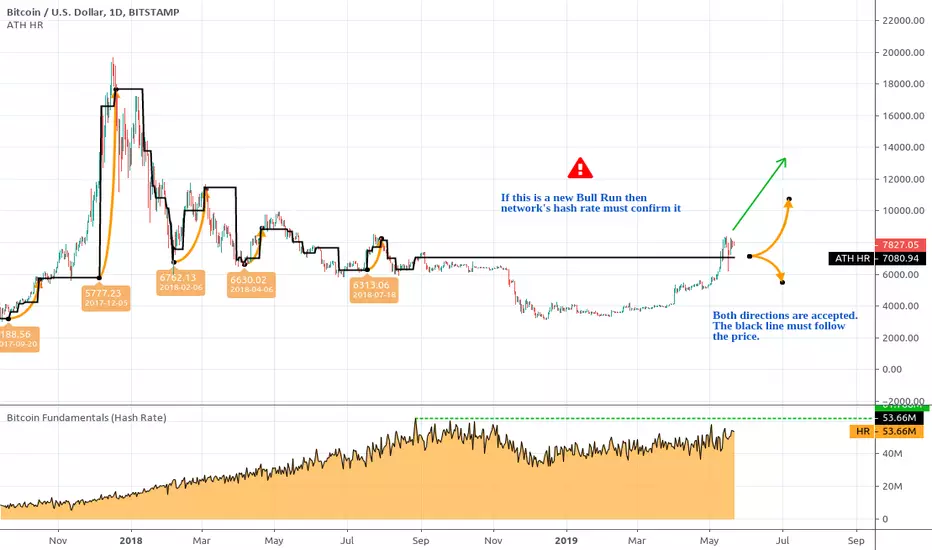
Bitcoin All-Time High (ATH) Hash Rate Level An experimental Bitcoin TotheMoon confirmation tool. Represents a mapping of Bitcoin's All-Time Hash Rate to the corresponding Bitcoin's price on the chart.
As always, you can support the author with donations via PayPal or crypto.
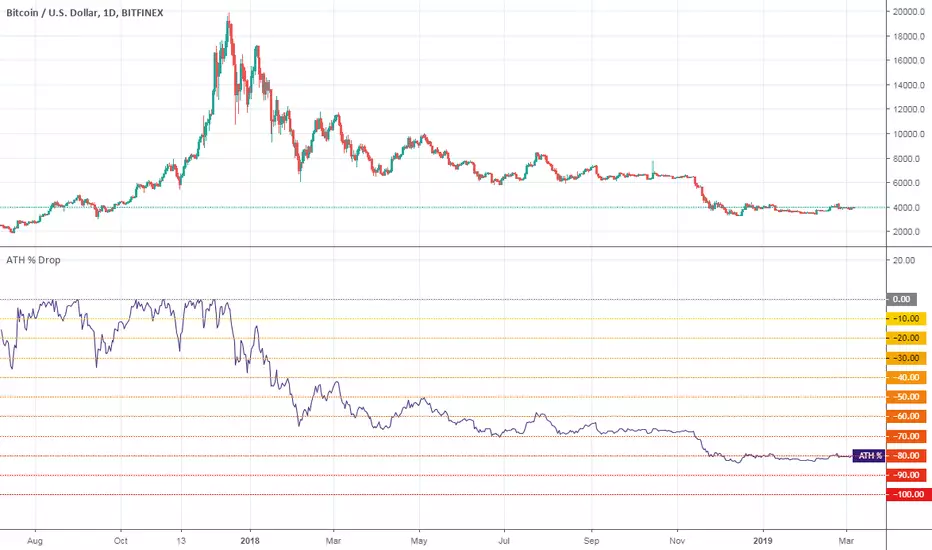
All-Time High % DropA utility tool to show price % drop since All-Time High.
Works on any ticker/instrument/asset.
Good luck!
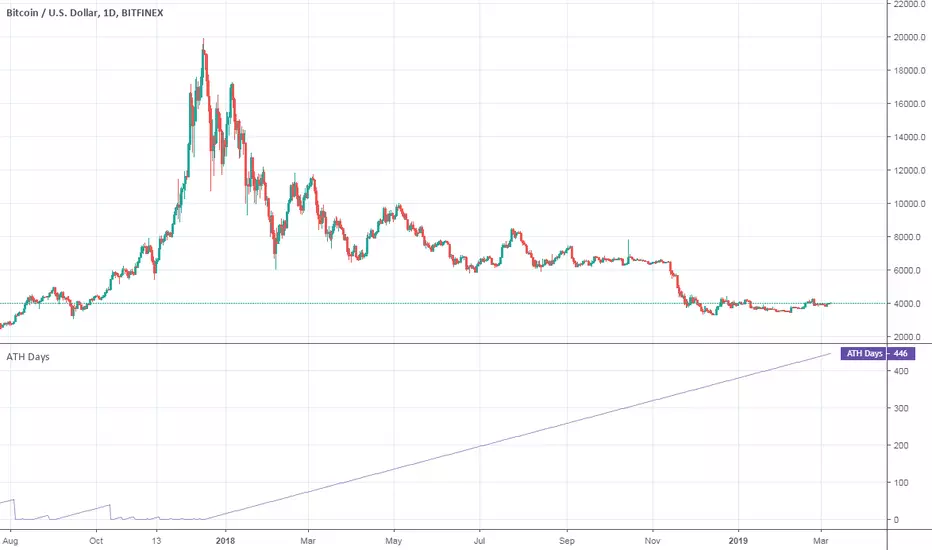
All-Time High DaysA utility tool to count days since an all-time high.
Works on any ticker/instrument/asset.
Good luck!