Ingenious SMA CrossoverIntroduction
A popular use for moving averages is to develop simple trading systems based on moving average crossovers. A trading system using two moving averages would give a buy signal when the shorter (faster) moving average advances above the longer (slower) moving average. A sell signal would be given when the shorter moving average crosses below the longer moving average. The speed of the systems and the number of signals generated will depend on the period of the moving averages.
What is this tool?
This tool is a crossover system of two simple moving averages. I called it "Ingenious" because it uses a decision tree-based algorithm under the hood to find and plot the most profitable SMA combination.
It analyzes the range of periods between 4 to 45 and backtests each combination across the entire history of an instrument. If the more profitable periods were detected the indicator will switch periods of the moving averages to the found ones immediately.
NOTE : It does not change what has already been plotted.
Good luck!
Algorithmic

Profitable Vortex Indicator ScannerIntroduction
The Vortex Indicator is a technical indicator invented by Etienne Botes and Douglas Siepman (Technical Analysis of Stocks & Commodities, V.28:1 (January, 2010): "The Vortex Indicator") to identify the start of a new trend or the continuation of an existing trend within financial markets.
It is composed of two lines, +VI and -VI . +VI represents up trending momentum and -VI represents down trending momentum.
The most basic strategy is to use the crossovers as trade signals:
when +VI crosses above -VI , go Long
when -VI crosses above +VI , go Short
Exit when a crossover occurs in the opposite direction
What is this tool?
This tool is a performance scanner that uses a decision tree-based algorithm under the hood to find the most profitable period's setting for the indicator. It analyzes the range of periods between 2 to 100 and backtests the Vortex Indicator for each period using the strategy mentioned above across the entire history of an instrument.
Settings
Net Profit line is optional and can be hidden through settings.
Alerts
It has an alert that notifies when a more profitable period was detected.
NOTE : It does not change what has already been plotted.
Good luck!

Trend Precognition - Mtrl_Scientist (arrow-only)Hey everybody,
Per request, I'm also adding the arrow-version to the updated base algorithm.
However, I advise everyone to also add the indicator version that I published previously.

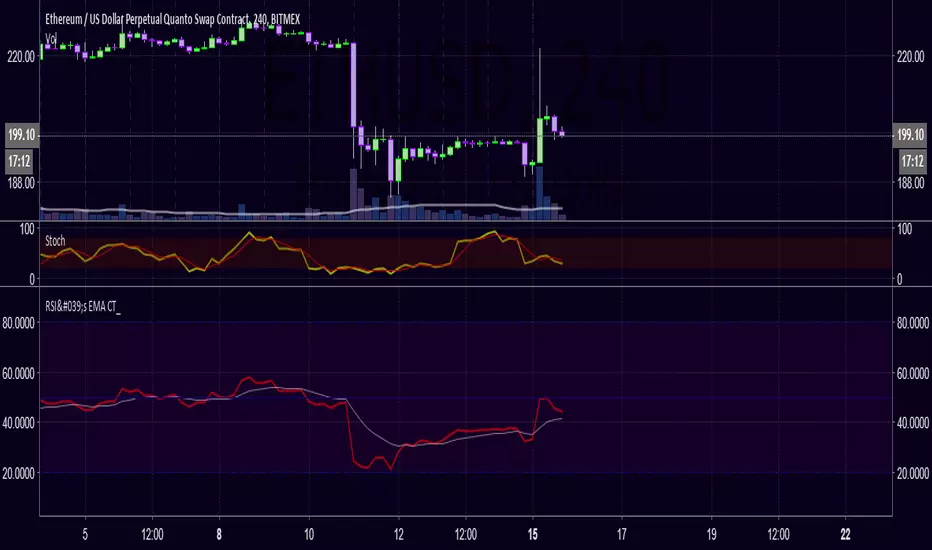
RSI's EMA by @cryptoTrader_RSI Indicator with EMA of RSI. Great Confirming Signals. Modified version of CM_ and lazyBear. *RSI is red
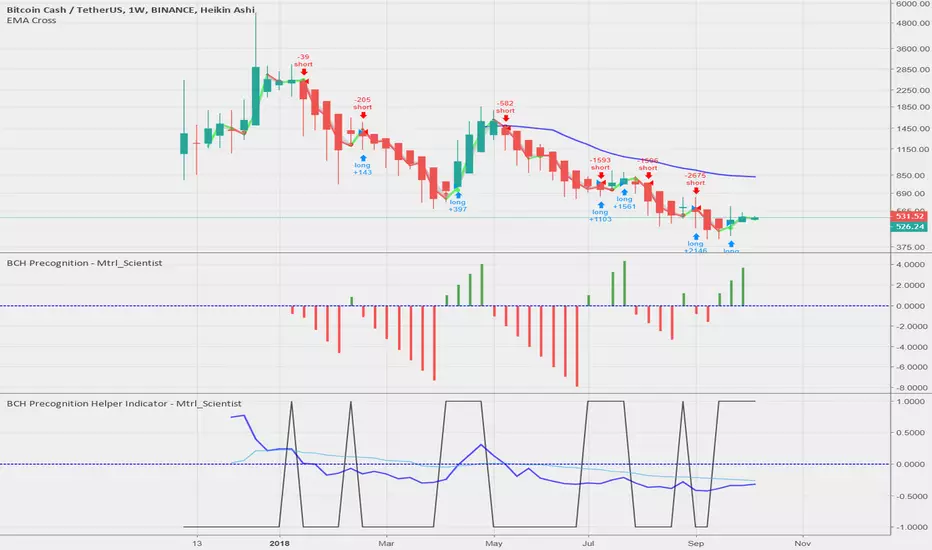
BCH Precognition - Mtrl_ScientistHello everyone,
Following up on my first bot, I've tuned my algorithm to work with Bitcoin Cash. In order to get rid of these nasty (and sometimes costly) indecision points, I've just enabled the 'Recalculated After Order Fill' option, which... well, recalculates the algorithm on the spot (instead of waiting for 1 additional bar) for situations where a signal is immediately followed by a conflicting signal, effectively cancelling it out. Obviously you have to rely on your own judgement if that happens in a real world scenario. However, in this simulated environment, this change resulted in a 0% risk, whereas the gain exceeded 800% with an initial capital of $100'000.
Again, in order for the results to be as accurate as possible, I've averaged the date from all major exchanges.
All of this is free to use for you, and you are welcome to share it.
If you like it, please give me a follow on Trading View & Twitter.
If you have any requests or suggestions/concerns, please let me know!
Note:
- This algorithm works best for Heikn Ashi candles, but I'm working on improving it for normal candles
- This is not financial advice (I'm in chemistry, not finance), so do your own research
Mtrl_Scientist
BTC Precognition - Mtrl_ScientistHello Everyone,
I have been interested in algorithmic trading for a while now, and have picked up coding in Python/C++ 2 years ago, which made it possible for me to understand Pine Script (Trading View's proprietary language) fairly easily. I got interested in Bitcoin in 2013, but have only started actually investing in mid 2017. Making money during a bull run is easy but it's really the bear market that teaches you a lesson. So I went about and tried to avoid losses in future bear markets by digging into the analysis of financial time series. I looked around and found useful books, examples of pine script code, technical analyses from fellow chartists and sought out to combine it all into algorithms that can help prevent losses during the next bear market.
I came up with several profitable scripts, but let this be the first one I'm actually sharing with you guys. It draws data from all major Bitcoin exchanges (Hence this script will ONLY work for BTCUSD ) and is based on CVI, Fractal Adaptive Moving Avergage ( FRAMA ), and some calculus operations to make sense of their relationship.
I tried to tidy the final version up as much as possible, so that it becomes straightforward to use. All you need to look at is when the bar becomes green/red, the bar height is just the integrated area since it's crossed the 0-line and can serve as a threshold on lower time frames to avoid noise.
I've got a degree in Chemistry, so don't take this as financial advice, but please do let me know what you think!
Note:
- This is a re-upload because the first version got pulled due to linking to Twitter
- Script works best with Hekin Ashi candles
Planned features:
- Reduce amount of signals on lower time frames
- Make it work better with normal candles
Suggestions?

Quantitative R-Difference Trading Strategy/SystemWorks extremely well with many stocks.
This strategy was tested on all components of the Dow since 1987. It averaged 22% a year. Slippage and commission were accounted for. 70% of the trades were profitable. The average maximum drawdown was around 15%.
This strategy has also been tested against random. The results indicate that this strategy's results are not due to random chance, but rather it has an edge in the stock market.
Does not repaint, and is not a curve fitted strategy.

14/28 Day SMA Divergence and RSI - No RepaintIf you are interested in purchasing my algorithmic trading bot that receives Tradingview indicator alerts via email and then executes them in Bittrex, please visit my product page here: ilikestocks.com Additionally, I would love to create video/blog guides on creating Tradingview scripts or strategies. If you are a knowledgeable in finance or other related fields and would like to be featured on my page, please contact me at tanner@ilikestocks.com.
No crossovers were used in this script, and this is likely the reason for the no repaint(Correct me if wrong).
This strategy script uses a 14-day SMA signal line, a 28-day SMA and RSI. The strategy works by determining whether the (14-day SMA is above the 28-day SMA and the RSI levels are overbought(below 30)) or RSI is very overbought(below 13 or so). Once either of these conditions have been met, a long position is opened.
The initial long position must be partially closed by the take profit first and then the final close is executed if the 14-day signal SMA is below the 28-day SMA; you may also exclusively use take profit to close positions.
The green plotted spikes are the initial long position conditions. The orange plotted spikes are take profit signals once a long position is opened. The red plotted spikes are plotted when the SMA 14-day is below the 28-day SMA.
Please do leave constructive criticism or comments below because it helps me better create scripts!
