Safe Supertrend Strategy (No Repaint)Overview
The Safe Supertrend is a repaint-free version of the popular Supertrend trend-following indicator.
Most Supertrend indicators appear perfect on historical charts because they flip intrabar and then repaint after the candle closes.
This version fixes that by using close-of-bar confirmation only, making every trend flip 100% stable, safe, and non-repainting.
Why This Supertrend Doesn’t Repaint
Most Supertrend indicators calculate their trend direction using the current bar’s data.
But during a live candle:
ATR expands and contracts
The upper/lower bands move
Price moves above/below the band temporarily
A false flip appears → then disappears when the candle closes
That is classic repainting.
This indicator avoids all of that by using:
close > upper
close < lower
This means:
Trend direction flips only based on the previous candle,
No intrabar calculations,
No flickering signals,
No “perfect but fake” historical performance.
Every signal you see on the chart is exactly what was available in real-time.
How It Works
Calculates ATR (Average True Range) and SMA centerline
Builds upper and lower volatility bands
Confirms trend flips only after the previous bar closes
Plots clear bull and bear reversal signals
Works on all markets (crypto, stocks, forex, indices)
No repainting, no recalc, no misleading flips.
Bullish Signal (Trend Up)
A bullish trend begins only when:
The previous candle closes above the upper ATR band,
And this flip is fully confirmed.
A green triangle marks the start of a new uptrend.
Bearish Signal (Trend Down)
A bearish trend begins only when:
The previous candle closes below the lower ATR band,
And the downtrend is confirmed.
A red triangle signals the start of a new downtrend.
Inputs
ATR Length - default 10
ATR Multiplier - default 3.0
Works on all timeframes and market
Simple, but powerful.
Why Use This Version Instead of a Regular Supertrend?
Most Supertrends:
Look great historically
But repaint continuously on live charts
Give false trend flips intrabar
Cannot be reliably used in strategies
This version:
Uses strict previous-bar logic
Never repaints trend direction
Works perfectly in live trading
Backtests accurately
Is ideal for algorithmic strategies
Ideal For:
Trend-following strategies
Breakout trading
Algo trading systems
Reversal detection
Filtering market noise
Swing trading & scalping
Final Note
This is a safer, more reliable Supertrend designed for real-world use — not perfect-looking repaint illusions.
If you use Supertrend in your trading system, this no-repaint version ensures your signals are trustworthy and consistent.
Algo

EMA + RSI Autotrade Webhook - VarunOverview
The EMA + RSI Autotrade Webhook is a powerful trend-following indicator designed for automated crypto futures trading. This indicator combines the reliability of Exponential Moving Average (EMA) crossovers with RSI momentum filtering to generate high-probability buy and sell signals optimized for webhook integration with crypto exchanges like Delta Exchange, Binance Futures, and Bybit.Key Features
Simple & Effective: Uses proven EMA 9/21 crossover strategy
RSI Momentum Filter: Eliminates low-probability trades in ranging markets
Webhook Ready: Two clean alerts (LONG Entry, SHORT Entry) for seamless automation
Exchange Compatible: Works with Delta Exchange, 3Commas, Alertatron, and other webhook platforms
Zero Lag Signals: Real-time alerts on crossover confirmation
Visual Clarity: Clean chart markers for easy signal identification
How It Works
Entry Signals:
LONG Entry: Triggers when EMA 9 crosses above EMA 21 AND RSI is above 52 (bullish momentum confirmed)
SHORT Entry: Triggers when EMA 9 crosses under EMA 21 AND RSI is below 48 (bearish momentum confirmed)
Technical Components:
Fast EMA: 9-period (tracks short-term price action)
Slow EMA: 21-period (identifies primary trend)
RSI: 14-period (confirms momentum strength)
RSI Long Threshold: 52 (filters weak bullish signals)
RSI Short Threshold: 48 (filters weak bearish signals)
Best Use Cases
Crypto Futures Trading: Bitcoin, Ethereum, Altcoin perpetual contracts
Automated Trading Bots: Integration with Delta Exchange webhooks, TradingView alerts
Timeframes: Optimized for 15-minute charts (works on 5min-1H)
Markets: Trending crypto markets with clear directional moves
Risk Management: Best used with 1-2% stop loss per trade (managed externally)
Webhook Automation Setup
Add indicator to your TradingView chart
Create alerts for "LONG Entry" and "SHORT Entry"
Configure webhook URL from your exchange (Delta Exchange, Binance, etc.)
Use alert message: Entry LONG {{ticker}} @ {{close}} or Entry SHORT {{ticker}} @ {{close}}
Exchange automatically reverses positions on opposite signals
Advantages
✅ No manual trading required - fully automated
✅ Eliminates emotional trading decisions
✅ Catches trending moves early with EMA crossovers
✅ RSI filter reduces whipsaws in choppy markets
✅ Works 24/7 without monitoring
✅ Simple two-alert system (easy to manage)
✅ Compatible with multiple exchanges via webhooksStrategy Philosophy
This indicator follows a trend-following with momentum confirmation approach. By waiting for both EMA crossover AND RSI confirmation, it ensures you're entering trades with genuine momentum behind them, not just random price noise. The tight RSI thresholds (52/48) keep you aligned with the prevailing trend.Recommended Settings
Timeframe: 15-minute (primary), 5-minute (scalping), 1-hour (swing)
Markets: BTC/USDT, ETH/USDT, high-liquidity altcoin perpetuals
Position Sizing: 100% capital per signal (exchange manages reversals)
Stop Loss: 2% (managed via exchange or external bot)
Leverage: 1-2x for conservative approach, up to 5x for aggressive
Important Notes
⚠️ This indicator generates entry signals only - position reversals are handled automatically by your exchange
⚠️ Always backtest on historical data before live trading
⚠️ Use proper risk management and position sizing
⚠️ Best performance in trending markets; may generate false signals in tight ranges
⚠️ Requires TradingView Premium or higher for webhook functionalityTags
cryptocurrency futures automated-trading ema-crossover rsi webhook delta-exchange tradingview-alerts trend-following momentum bitcoin ethereum crypto-bot algo-trading 15-minute-strategy

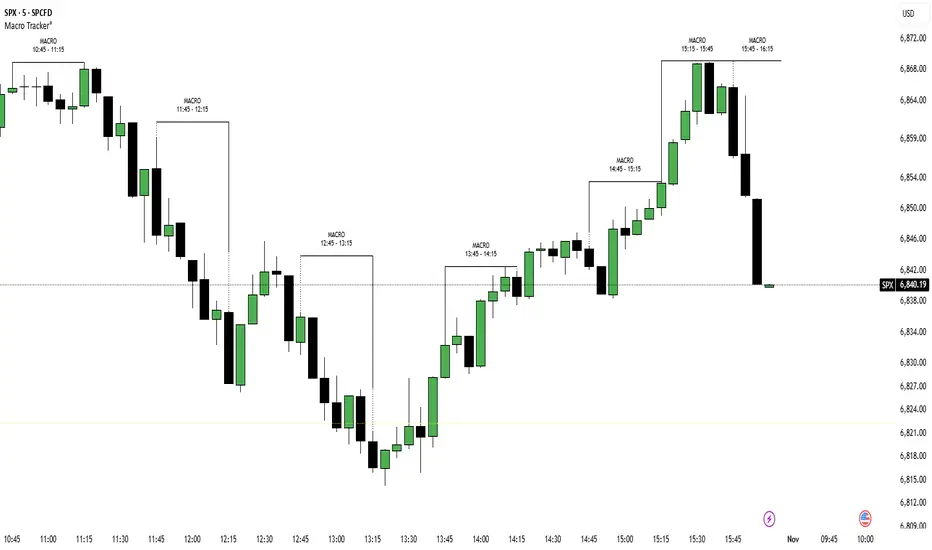
ICT Macro Tracker (xx:45-xx:15) (MTMGBS)Adjusted pinescript to reflect xx:45-xx:15 instead of the traditional xx:50-xx:15
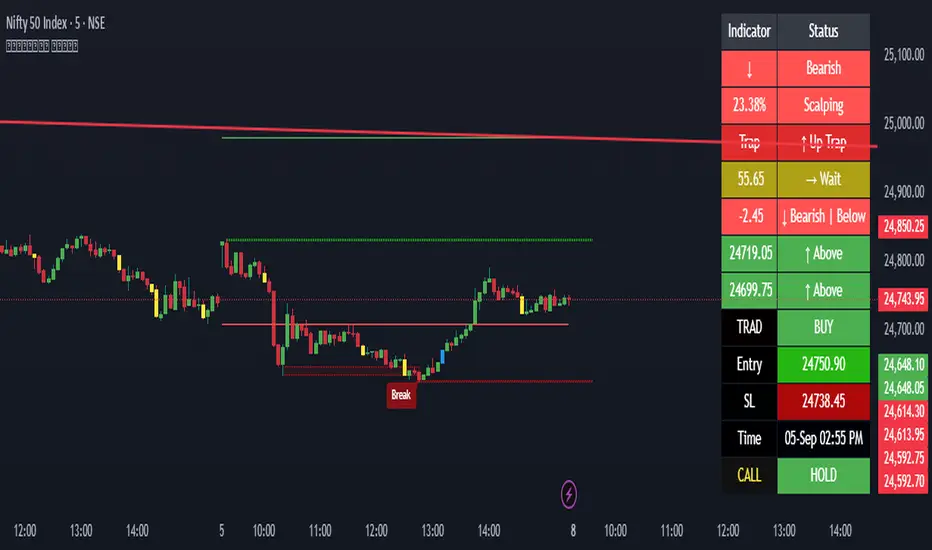
Algoritmictrader2025 ALGO System profitability works with a minimum profit margin of 75% and the maximum profit margin per share is around 95%. The software costs $150 per month.

Ant_JJun 5-Minute Day-Trading IndicatorThis invite-only indicator is designed for short-term BTC and crypto trading, focusing on precision during volatile data-driven markets and capital protection during sideways conditions.
It integrates Ichimoku-based structure mapping with volume asymmetry analysis and proprietary rule-based filters.
Unlike a traditional mashup, this system does not simply overlay multiple indicators.
It uses Ichimoku’s leading spans to classify structural bias (trend vs. neutral), then evaluates directional confirmation through candle displacement and volume pressure imbalance.
Only when both structure and momentum align is a directional label printed.
If the system detects indecision (flat or overlapping clouds with contracting volume), it enters a neutral state to avoid unnecessary exposure.
Key concept:
— Preventing bleed during non-trending phases
— Adaptive response around macro/volatility events (e.g., CPI, PMI)
— Rule-based execution to remove emotional decision-making
Usage notes:
— Intended for 5-minute intraday use
— Long/Short labels appear only on rule-confirmed entries
— No repainting / no backfill logic
— Analytical use only — not investment advice

AlgoAIDESIGNED FOR HEIKEN ASHI BARS
Gain Access here: algoai.store
AlgoAI
The Dark Edge of Trading
An AI-powered TradingView strategy that thrives across all markets. Short altcoin pumps. Ride NAS100 waves. Dominate gold, FX, stocks, and futures — all with one AI brain.
#1
Semi-Automatic Trading (Recommended)
Set up alerts on AlgoAI signals. As they come in, grade the setups and choose to enter manually. This gives you full control while leveraging AI precision.
#2
Fully Automated Trading
Pass signals via webhooks to TradersPost for futures or PineConnector for FX. Note: When running fully automated, it's suggested to use long-only or short-only mode to avoid side swiping and potential unintended drawdown.
BITSTAMP:BTCUSD

TrendIsYourFriend Strategy (SPY,IWM,VYM,XLK,SPXL,BTC,GOLD,VT...)Personal disclaimer
Don’t trust this strategy. Don’t trust any other model either just because of its author or a backtest curve. Overfitting is an easy trap, and beginners often fall into it. This script isn’t meant to impress you. It’s meant to survive reality. If it does, maybe it will raise questions and you’ll remember it.
Legal disclaimer
Educational purposes only. Not financial advice. Past performance is not indicative of future results.
Strategy description
Long-only, trend-based logic with two entry types (trend continuation or excess-move reversion), dynamic stop-losses, and a VIX filter to avoid turbulent markets.
Minimal number of parameters with enough trades to support robustness.
For backtest, each trade is sized at $10,000 flat (no compounding, to focus on raw model quality and the regularity of its results over time).
Fees = $0 (neutral choice, as brokers differ).
Slippage = $0, deliberate choice: most entries occur on higher timeframes, and some assets start their history on charts at very low prices, which would otherwise distort results.
What makes this script original
Beyond a classical trend calculation, both excess-move entries and dynamic stop-loss exits also rely on trend logic. Except for the VIX filter, everything comes from trend functions, with very few parameters.
Pre-configurations are fixed in the code, allowing sincere performance tracking across a dozen cases over the medium to long term.
Allowed
SPY (ARCA) — 2-hour chart: S&P 500 ETF, most liquid equity benchmark
IWM (ARCA) — Daily chart: Russell 2000 ETF, US small caps
VYM (ARCA) — Daily chart: Vanguard High Dividend Yield ETF
XLK (ARCA) — Daily chart: Technology Select Sector SPDR
SPXL (ARCA) — Daily chart: 3× leveraged S&P 500 ETF
BTCUSD (COINBASE) — 4-hour chart: Bitcoin vs USD
GOLD (TVC) — Daily chart: Gold spot price
VT (ARCA) — Daily chart: Vanguard Total World Stock ETF
PG (NYSE) — Daily chart: Procter & Gamble Co.
CQQQ (ARCA) — Daily chart: Invesco China Technology ETF
EWC (ARCA) — Daily chart: iShares MSCI Canada ETF
EWJ (ARCA) — Daily chart: iShares MSCI Japan ETF
How to use and form an opinion on it
Works only on the pairs above.
Feel free to modify the input parameters (slippage, fees, order size, margins, …) to see how the model behaves under your own conditions
Compare it with a simple Buy & Hold (requires an order size of 100% equity).
You may also want to look at its time-in-market — the share of time your capital is actually at risk.
Finally, let me INSIST on this : let it run live for months before forming an opinion!
Share your thoughts in the comments 🚀 if you’d like to discuss its live performance.

Apex Edge – Liquidity RaiderApex Edge – Liquidity Raider
The Predator That Hunts Where Retail Never Looks
The Liquidity Raider is not your average liquidity line plotter.
This is an institutional-grade hunting system that tracks the pools of liquidity Smart Money algos stalk — and tells you exactly when price is circling in for the strike.
Where most retail tools simply mark lines, this one acts like a predator:
Scans the chart dynamically to detect clustered highs & lows (pivot-based liquidity zones).
Filters noise with sensitivity & price rounding so you only get real liquidity levels — not every random swing.
Plots live BSL (Buy-Side Liquidity) & SSL (Sell-Side Liquidity) lines in clean dotted format.
Auto-deletes levels when swept, so your chart stays clean and focused.
Triggers directional arrows when price comes within your specified % distance to the target liquidity pool — before the market moves.
EMA confluence layer lets you align with institutional flow (customizable Fast & Slow EMAs).
Core Power
Cluster Logic – Finds high-probability liquidity zones using repeated pivot levels.
Sweep Awareness – Lines vanish the moment liquidity is taken, keeping focus on the next pool.
Proximity Strike Detection – Arrow signals only when price is within striking range.
Directional Clarity – Red arrows = targeting BSL, Green arrows = targeting SSL.
Scalable Across Timeframes – Adapts to your chart’s timeframe with dynamic lookback scaling.
Institutional Flow Filter – Optional EMA confirmation keeps you aligned with the real trend.
How to Use
Identify liquidity pools – Dotted green = buy-side, dotted red = sell-side.
Watch proximity arrows – These mean price is in range and hunting that pool.
Align with EMA bias – Enter only in the direction of institutional momentum.
Target the sweep – Your take profit is where the liquidity is resting.
Why Liquidity Raider Wins
This is not a lagging signal system.
It’s a real-time, clean, predictive tool designed to mimic the targeting logic of high-frequency algos.
By removing swept levels and focusing only on the next available pools, Liquidity Raider keeps you one step ahead of the crowd — and perfectly positioned for the kill shot.

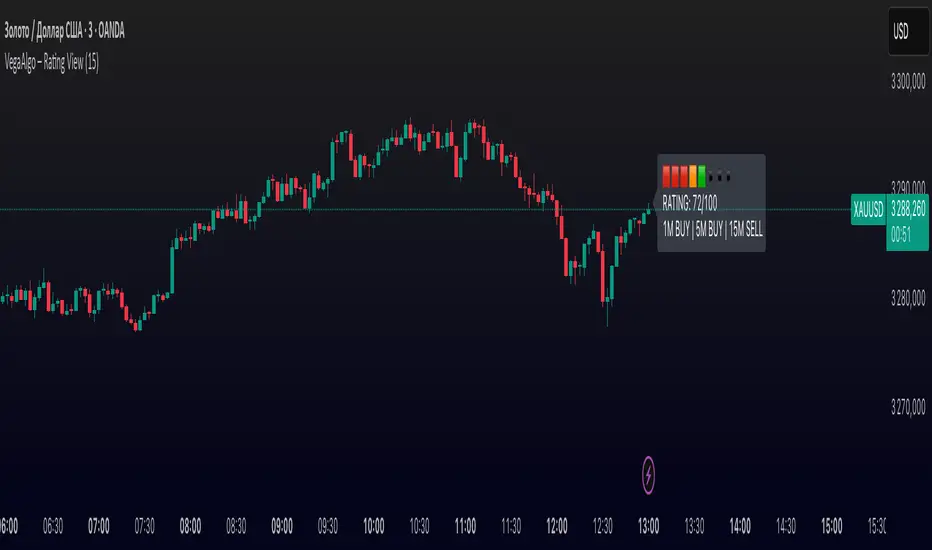
VegaAlgo – Rating ViewVegaAlgo – Rating View is a market condition analysis tool designed to evaluate the current price structure.
The indicator calculates a RATING (from 0 to 100) that reflects how clean, directional, and structured the recent price movement is. The rating is based on the number of price direction changes (from bullish to bearish candles and vice versa) within a selected period. Fewer direction changes indicate a clearer trend and result in a higher rating, while a choppy or highly volatile market leads to a lower score.
Additionally, the indicator provides directional signals on three key timeframes — 1M, 5M, and 15M, using a comparison of fast and slow moving averages. This allows traders to quickly assess the dominant trend both locally and across higher timeframes.
This script is intended for visual market analysis only and should not be considered financial advice.
ThinkTech AI SignalsThink Tech AI Strategy
The Think Tech AI Strategy provides a structured approach to trading by integrating liquidity-based entries, ATR volatility thresholds, and dynamic risk management. This strategy generates buy and sell signals while automatically calculating take profit and stop loss levels, boasting a 64% win rate based on historical data.
Usage
The strategy can be used to identify key breakout and retest opportunities. Liquidity-based zones act as potential accumulation and distribution areas and may serve as future support or resistance levels. Buy and sell zones are identified using liquidity zones and ATR-based filters. Risk management is built-in, automatically calculating take profit and stop loss levels using ATR multipliers. Volume and trend filtering options help confirm directional bias using a 50 EMA and RSI filter. The strategy also allows for session-based trading, limiting trades to key market hours for higher probability setups.
Settings
The risk/reward ratio can be adjusted to define the desired stop loss and take profit calculations. The ATR length and threshold determine ATR-based breakout conditions for dynamic entries. Liquidity period settings allow for customized analysis of price structure for support and resistance zones. Additional trend and RSI filters can be enabled to refine trade signals based on moving averages and momentum conditions. A session filter is included to restrict trade signals to specific market hours.
Style
The strategy includes options to display liquidity lines, showing key support and resistance areas. The first 15-minute candle breakout zones can also be visualized to highlight critical market structure points. A win/loss statistics table is included to track trade performance directly on the chart.
This strategy is intended for descriptive analysis and should be used alongside other confluence factors. Optimize your trading process with Think Tech AI today!

Flow Optimized Moving AverageOverview
The Flow Optimized Moving Average (Flow OMA) is an advanced adaptive moving average designed to dynamically adjust smoothing factors based on market efficiency and volatility. By integrating the Efficiency Ratio (ER) with an Adaptive Moving Average (AMA) and leveraging ATR-based bands, this indicator provides traders with a refined tool for identifying trend direction, strength, and potential reversal zones.
Key Features
Adaptive Moving Average (AMA)
Adjusts to price action based on the Efficiency Ratio (ER), reducing lag in trending markets while smoothing noise in ranging conditions.
Efficiency Ratio (ER)
Measures the effectiveness of price movement over a defined lookback period.
Helps in dynamically adjusting the smoothing constant of the AMA.
ATR-Based Volatility Bands
Creates upper and lower dynamic bands based on the Average True Range (ATR).
Expands in high volatility and contracts in low volatility, providing traders with a contextual understanding of price action.
Slope-Based Trend Strength
Normalizes the moving average slope relative to ATR.
Generates a trend strength score, which influences band opacity, making strong trends visually distinguishable.
Dynamic Color Coding
Bullish Trends: Cyan/Turquoise (#00e2ff)
Bearish Trends: Blue (#003ff5)
Neutral Trends: Gray
The transparency of the bands dynamically adjusts based on trend strength.
Fill Zone Effect
The area between the ATR bands is filled with a gradient-like effect, giving a clear visual representation of trend strength and transitions.
Indicator Components
Inputs (User Settings)
ER Lookback Period: Defines how many bars are used in the Efficiency Ratio calculation (default: 10).
Fast & Slow Periods: Control the sensitivity of the Adaptive Moving Average (default: 2 & 30).
ATR Period: Defines the lookback for Average True Range (default: 14).
Band Multiplier: Determines the width of ATR-based bands (default: 1.5).
Slope Average Period: Smooths trend slope for more stable trend assessment (default: 5).
Efficiency Ratio Calculation
Measures how effectively price moves in a straight line compared to its total movement.
A higher ER value suggests strong trend momentum, while a lower value implies consolidation.
Adaptive Moving Average (AMA)
Dynamically adjusts its smoothing factor based on ER.
Uses a smoothing constant that ranges between the fastest and slowest specified values.
Volatility-Based Bands
Constructed using the ATR multiplier.
Expand and contract dynamically in response to market volatility.
Trend Strength & Direction
Computed using the normalized slope of AMA against ATR.
Positive slope = Bullish trend, Negative slope = Bearish trend.
Visual Enhancements
Colored Adaptive MA Line: Changes based on trend direction.
ATR Bands with Gradient Fill: Visual representation of market conditions.
Dynamic Opacity: Highlights trend strength through transparency.
How to Use the Flow OMA Indicator
Trend Identification
When the Adaptive MA is rising and colored cyan, a bullish trend is in play.
When the Adaptive MA is falling and colored blue, a bearish trend is present.
Trend Strength Assessment
A stronger trend results in more opaque band fills, indicating a clear directional bias.
Weaker trends or consolidations result in fainter fills, signaling a loss of momentum.
Reversal Signals
If price touches the upper band in a bullish move and starts reversing, it can indicate potential profit-taking areas.
If price approaches the lower band in a bearish move and rebounds, a short-term reversal may be imminent.
Volatility Insights
Narrow bands indicate low volatility and possible breakout conditions.
Wider bands suggest increased volatility, warning traders of potential price swings.
Best Practices
✅ Combine with Other Indicators
Use RSI, MACD, or Volume Profile for confirmation before executing trades.
✅ Apply to Multiple Timeframes
Works effectively in higher timeframes (1H, 4H, Daily) for trend trading.
Can be utilized in lower timeframes (5m, 15m) for scalping setups.
✅ Adjust Parameters Based on Asset Volatility
Increase ATR Period for stocks with high volatility.
Reduce ATR Multiplier for forex pairs to avoid excessive band width.
The Flow Optimized Moving Average (Flow OMA) is a powerful trend-following tool designed for both swing and intraday traders. Its adaptive nature allows it to efficiently track trends while minimizing false signals. By incorporating dynamic volatility bands and trend-sensitive color coding, this indicator enhances traders' ability to read price action effectively. Whether used standalone or in combination with other indicators, Flow OMA provides a significant edge in trend analysis.

Volume Flow Indicator Signals | iSolani
Volume Flow Indicator Signals | iSolani: Decoding Trend Momentum with Volume Precision
In markets where trends are fueled by institutional participation, discerning genuine momentum from false moves is critical. The Volume Flow Indicator Signals | iSolani cuts through this noise by synthesizing price action with volume dynamics, generating high-confidence signals when capital flows align with directional bias. This tool reimagines traditional volume analysis by incorporating volatility-adjusted thresholds and dual-layer smoothing, offering traders a laser-focused approach to trend identification.
Core Methodology
The indicator employs a multi-stage calculation to quantify volume-driven momentum:
Volatility-Adjusted Filter: Measures price changes via log returns, scaling significance using a 30-bar standard deviation multiplied by user-defined sensitivity (default: 2x).
Volume Normalization: Caps extreme volume spikes at 3x the 50-bar moving average, preventing distortion from anomalous trades.
Directional Volume Flow: Assigns positive/negative values to volume based on whether price movement exceeds volatility-derived thresholds.
Dual Smoothing: Applies consecutive SMA (3-bar) and EMA (14-bar) to create the Volume Flow Indicator (VFI) and its signal line, filtering out transient fluctuations.
Breaking New Ground
This implementation introduces three key innovations:
Adaptive Noise Gates: Unlike static volume oscillators, the sensitivity coefficient dynamically adjusts to market volatility, reducing false signals during choppy conditions.
Institutional Volume Capping: The vcoef parameter limits the influence of outlier volume spikes, focusing on sustained institutional activity rather than one-off trades.
Non-Repainting Signals: Generates single-per-trend labels (buy below bars, sell above) to avoid chart clutter while maintaining visual clarity.
Engine Under the Hood
The script executes through five systematic stages:
Data Preparation: Computes HLC3 typical price and its logarithmic rate of change.
Threshold Calculation: Derives dynamic cutoff levels using 30-period volatility scaled by user sensitivity.
Volume Processing: Filters raw volume through a 50-bar SMA, capping extremes at 3x average.
VFI Construction: Sums directional volume flow over 50 bars, smoothed with a 3-bar SMA.
Signal Generation: Triggers alerts when VFI crosses zero, confirmed by a 14-bar EMA crossover.
Standard Configuration
Optimized defaults balance responsiveness and reliability:
Volume MA: 50-bar smoothing window
Sensitivity: 2.0 (doubles volatility threshold)
Signal Smoothing: 14-bar EMA
Volume Cap: 3x average (hidden parameter)
VFI Smoothing: Enabled (3-bar SMA)
By fusing adaptive volume filtering with price confirmation logic, the Volume Flow Indicator Signals | iSolani transforms raw market data into institutional-grade trend signals. Its ability to mute choppy price action while amplifying high-conviction volume moves makes it particularly effective for spotting early trend reversals in equities, forex, and futures markets.

TradeShields Strategy Builder🛡 WHAT IS TRADESHIELDS?
This no-code strategy builder is designed for traders on TradingView, offering an intuitive platform to create, backtest, and automate trading strategies. While identifying signals is often straightforward, the real challenge in trading lies in managing risk and knowing when not to trade. It equips users with advanced tools to address this challenge, promoting disciplined decision-making and structured trading practices.
This is not just a collection of indicators but a comprehensive toolkit that helps identify high-quality opportunities while placing risk management at the core of every strategy. By integrating customizable filters, robust controls, and automation capabilities, it empowers traders to align their strategies with their unique objectives and risk tolerance.
_____________________________________
🛡 THE GOAL: SHIELD YOUR STRATEGY
The mission is simple: to shield your strategy from bad trades . Whether you're a seasoned trader or just starting, the hardest part of trading isn’t finding signals—it’s avoiding trades that can harm your account. This framework prioritizes quality over quantity , helping filter out suboptimal setups and encouraging disciplined execution.
With tools to manage risk, avoid overtrading, and adapt to changing market conditions, it protects your strategy against impulsive decisions and market volatility.
_____________________________________
🛡 HOW TO USE IT
1. Apply Higher Timeframe Filters
Begin by analyzing broader market trends using tools like the 200 EMA, Ichimoku Cloud, or Supertrend on higher timeframes (e.g., daily or 4-hour charts).
- Example: Ensure the price is above the 200 EMA on the daily chart for long trades or below it for short trades.
2. Identify the Appropriate Entry Signal
Choose an entry signal that aligns with your model and the asset you're trading. Options include:
Supertrend changes for trend reversals.
Bollinger Band touches for mean-reversion trades.
RSI strength/weakness for overbought or oversold conditions.
Breakouts of key levels (e.g., daily or weekly highs/lows) for momentum trades.
MACD and TSI flips.
3. Determine Take-Profit and Stop-Loss Levels
Set clear exit strategies to protect your capital and lock in profits:
Use single, dual, or triple take-profit levels based on percentages or price levels.
Choose a stop-loss type, such as fixed percentage, ATR-based, or trailing stops.
Optionally, set breakeven adjustments after hitting your first take-profit target.
4. Apply Risk Management Filters
Incorporate risk controls to ensure disciplined execution:
Limit the number of trades per day, week, or month to avoid overtrading.
Use time-based filters to trade during specific sessions or custom windows.
Avoid trading around high-impact news events with region-specific filters.
5. Automate and Execute
Leverage the advanced automation features to streamline execution. Alerts are tailored specifically for each supported platform, ensuring seamless integration with tools like PineConnector, 3Commas, Zapier, and more.
_____________________________________
🛡 CORE FOCUS: RISK MANAGEMENT, AUTOMATION, AND DISCIPLINED TRADING
This builder emphasizes quality over quantity, encouraging traders to approach markets with structure and control. Its innovative tools for risk management and automation help optimize performance while reducing effort, fostering consistency and long-term success.
_____________________________________
🛡 KEY FEATURES
General Settings
Theme Customization : Light and dark themes for a tailored interface.
Timezone Adjustment : Align session times and news schedules with your local timezone.
Position Sizing : Define lot sizes to manage risk effectively.
Directional Control : Choose between long-only, short-only, or both directions for trading.
Time Filters
Day-of-Week Selection : Enable or disable trading on specific days.
Session-Based Trading : Restrict trades to major market sessions (Asia, London, New York) or custom windows.
Custom Time Windows : Precisely control the timeframes for trade execution.
Risk Management Tools
Trade Limits : Maximum trades per day, week, or month to avoid overtrading.
Automatic Trade Closures : End-of-session, end-of-day, or end-of-week options.
Duration-Based Filters : Close trades if take-profit isn’t reached within a set timeframe or if they remain unprofitable beyond a specific duration.
Stop-Loss and Take-Profit Options : Fixed percentage or ATR-based stop-losses, single/dual/triple take-profit levels, and breakeven stop adjustments.
Economic News Filters
Region-Specific Filters : Exclude trades around major news events in regions like the USA, UK, Europe, Asia, or Oceania.
News Avoidance Windows : Pause trades before and after high-impact events or automatically close trades ahead of scheduled news releases.
Higher Timeframe Filters
Multi-Timeframe Tools : Leverage EMAs, Supertrend, or Ichimoku Cloud on higher timeframes (Daily, 4-hour, etc.) for trend alignment.
Chart Timeframe Filters
Precision Filtering : Apply EMA or ADX-based conditions to refine trade setups on current chart timeframes.
Entry Signals
Customizable Options : Choose from signals like Supertrend, Bollinger Bands, RSI, MACD, Ichimoku Cloud, or EMA pullbacks.
Indicator Parameter Overrides : Fine-tune default settings for specific signals.
Exit Settings
Flexible Take-Profit Targets : Single, dual, or triple targets. Exit at significant levels like daily/weekly highs or lows.
Stop-Loss Variability : Fixed, ATR-based, or trailing stop-loss options.
Alerts and Automation
Third-Party Integrations : Seamlessly connect with platforms like PineConnector, 3Commas, Zapier, and Capitalise.ai.
Precision-Formatted Alerts : Alerts are tailored specifically for each platform, ensuring seamless execution. For example:
- PineConnector alerts include risk-per-trade parameters.
- 3Commas alerts contain bot-specific configurations.
_____________________________________
🛡 PUBLISHED CHART SETTINGS: 15m COMEX:GC1!
Time Filters : Trades are enabled from Tuesday to Friday, as Mondays often lack sufficient data coming off the weekend, and weekends are excluded due to market closures. Custom time sessions are turned off by default, allowing trades throughout the day.
Risk Filters : Risk is tightly controlled by limiting trades to a maximum of 2 per day and enabling a mechanism to close trades if they remain open too long and are unprofitable. Weekly trade closures ensure that no positions are carried over unnecessarily.
Economic News Filters : By default, trades are allowed during economic news periods, giving traders flexibility to decide how to handle volatility manually. It is recommended to enable these filters if you are creating strategies on lower timeframes.
Higher Timeframe Filters : The setup incorporates confluence from higher timeframe indicators. For example, the 200 EMA on the daily timeframe is used to establish trend direction, while the Ichimoku cloud on the 30-minute timeframe adds additional confirmation.
Entry Signals : The strategy triggers trades based on changes in the Supertrend indicator.
Exit Settings : Trades are configured to take partial profits at three levels (1%, 2%, and 3%) and use a fixed stop loss of 2%. Stops are moved to breakeven after reaching the first take profit level.
_____________________________________
🛡 WHY CHOOSE THIS STRATEGY BUILDER?
This tool transforms trading from reactive to proactive, focusing on risk management and automation as the foundation of every strategy. By helping users avoid unnecessary trades, implement robust controls, and automate execution, it fosters disciplined trading.

Algo Market Structure (Nephew_Sam_)This indicator takes a different approach into reading market structure.
The key difference between this logic compared to the pivot logic is; we read highs and lows based on bullish and bearish candles. Ie:
Pivot method - highest/lowest point in previous and next X candles
Algo method - Bullish candle(s) followed by a bearish candle and vice versa
More explanation in each of the key feature below.
Here are all of the concepts and features included in the indicator:
Timeframe
- You can select the timeframe of the indicator (has to be higher or equal to the chart timeframe)
- Min option is the minimum timeframe to show the indicator. If you show daily structure on 1m chart, you can run into a timeout error so keep it close to the chart timeframe.
- Recommended timeframe for no bugs is the current chart timeframe.
Structure
The structure is calculated using a combination of candle patterns (ie. pivot top = Bullish x3-Bearish-Bullish) and marks out circle labels after a new HH or LL
Structure high = 1 or more consecutive bull candles followed by a bear candle
Structure low = 1 or more consecutive bear candles followed by a bull candle
Structure direction change = when the second previous H/L is taken out (TLQ)
ILQ - Inducement Liquidity concept
In a bearish example this is the most recent structure high.
TLQ
In a bearish example this is the second most recent structure high.
This is also what helps define our structure direction. If broken, the structure changes (bullish / bearish) and plots a bos line.
EPA - Efficient price action
When price returns back to previous structure point after bos. Similar to an ICT breaker.
Note: It might be a little, just a little buggy if you have set your indicator timeframe to higher than the chart timeframe.
Extremes Zones
The final zone to find a trade entry before a structural shift. These are wick of the TLQ candle. This is select the wick of the current timeframe candle even if indicator is set to higher timeframe.
MSU
Tiny arrow labels at the bottom of your chart. Plots the arrows when price is between an ILQ and TLQ
VTA
Valid trading range. This is when we get some sort of a structure pattern. Plots a box when price induces previous structure point and then breaks structure in the opposite direction. Here are the patterns:
Bull VTA - HH-LL-HH
Bear VTA - LL-HH-LL
Bull Strict VTA - LL-HH-LL-HH
Bear Strict VTA - HH-LL-HH-LL
Bar colors
Changes the bar color based on the structure to all green/red.
Note: for this to work, you will have to right click on the indicator, then under visual order select 'bring to front'
Table
This table plots the structure stats/data
1. If structure is bullish / bearish
2. If price is efficient or not
3. If there is an MSU
4. If price is inside a VTA
Disclaimer: This indicator is fully written from scratch by me, the idea behind the concepts come from AlgoHub material on Youtube. Do NOT use this code for reselling purposes and if anything is created using any part of this code, the source code should be public.

SFX Signals & Overlays [YinYangAlgorithms]SFX Signals & Overlays aims to help traders Identify Buy & Sell locations, Reversals, Volatility Zones, Support & Resistance and Overbought & Oversold Zones. All of these may work in harmony with each other by helping to identify when to enter and exit a trade; as well as helping to determine the risk / reward the trade may ensue.
SFX Signals & Overlays’s Buy & Sell signals are momentum based, meaning the Initial ‘Buy’ & ‘Sell’ signal may not be exactly where you want to get in/out. What may occur is the initial signal appears, a few more continuation signals appear afterwards (always in a chain); and once the momentum has ended a ‘Reversal’ signal appears. The reversal is there to help signify that the ‘opportune’ time to buy/sell may have passed and the price may now correct in the opposite direction. This Indicator aims to Buy Low and Sell High; and therefore the Buy signal momentum may occur as the price is either about to fall, currently falling or has started to consolidate. When the Buy signal momentum has ended, this means the momentum is at an impasse, but is favoring Buy momentum and a reversal (correction) may occur.
Buying & Selling at reversal signals may be profitable, however it may be less risky to DCA into your long / short positions during the Buy/Sell momentum signals instead. Let's get into the Tutorial so you can better understand how our SFX Signals & Overlays indicator works.
Tutorial:
Our example above showcases how our SFX Signals & Overlays Indicator looks on the default settings ‘Medium’ for each of our Algorithm Settings:
Trend Sensitivity
Signal Sensitivity
Zone Sensitivity
All of our Algorithm Settings feature 3 different speeds:
Fast
Medium
Slow
These speeds may be applied to each Algorithm Setting individually and affect how quickly they adapt to the current market's momentum. This allows you to tailor this Indicator to fit your trading style by adjusting it to meet your needs accordingly. If you are someone who likes to swing trade on the 1-5 minute timeframe, you may find better confluence with all settings on ‘Fast’. Medium term holders and traders may find better results with all settings on ‘Medium’. Likewise, long term investors may find best results with all settings on ‘Slow’. However, this shouldn’t stop you from finding your own best result by adjusting them individually to meet your own unique trading style.
SFX Signals & Overlays helps you identify shifts in momentum by displaying Momentum Signals. Momentum Signals are shown by either a Green or Red Triangle. Momentum Signals can continue for quite some time until the momentum has ended. We rank the first Momentum Signal from 1/5 to 5/5 for their strength and may help determine the chances of the momentum shift occurring. Once the Momentum Signals have ended we display a Reversal Signal. This Reversal Signal helps signify that the Momentum has ended. When the Momentum ends it means that a reversal may have started. This reversal may mean the price will continue in the direction the signal mentioned; or it may mean the price will consolidate. If the price consolidates then the signal is void as when the consolidation ends the price could go in either direction. If you notice consolidation occurring after a Reversal Signal; wait for more confirmations as it is now too risky.
Our Indicator displays different evaluations for each INITIAL Buy and Sell signal. These evaluations rank the current start of the signal from 1-5; 1 being the lowest and least reliable, 5 being the highest and most reliable. These rankings aren’t indefinite and are simply an evaluation at the time of the initial signal. We may potentially provide evaluations at the reversal later on if requested enough. When a Buy or Sell signal occurs this defines where momentum is occurring in this direction. This momentum is indicated by momentum signals shown through red / green triangles. These triangles indicate that this momentum is present. When these momentum signals end is when the Reversal Signal appears indicating that since this momentum has ended, there may be a decent chance of a reversal occurring. There also adherently may be the potential of consolidation occurring; but generally it means there is either a reversal, or consolidation + then a reversal or a continuation; however it may be apparent that the momentum has ended.
ES:
NQ:
BTC:
If you refer to the 3 examples above, we show how the ES, NQ and BTC look within a 5 minute scalping example. Essentially you’d make your decision on the Buy / Sell signal, the momentum signals, the Reversal Signals, the Trend Colors as well as other oscillators and Due Diligence.
Remember, there’s no such thing as a perfect entry / exit, the more you understand about trading and do your own Due Diligence the better. These Buy and Sell as well as Reversal signals attempt to locate and rank momentum shifts to help you identify where the momentum may be ending and reversing in the opposite direction.
Our zones defined by the Outer (red) and Inner (green) are representations of not only Support and Resistance locations, but likewise Overbought and Oversold locations. These zones help in multiple ways. The hard lines that define each zone's start / end are very useful locations of support / resistance which may indicate where the price will bounce off of. Likewise, when the price is within these zones it represents the price being Overbought or Oversold. Then the price is for instance within the Red Resistance Zone, what generally may happen is the price will correct quickly to get back to the ‘Black Empty Zone’ between the Red and Green zones; OR it may consolidate sideways until it has entered the ‘Black Empty Zone’. This is how the price may redeem itself back to being valued correctly. These zones help you identify and understand, in concatenation with our signals when and how much the price may move.
Our Settings are minimalistic so you don’t need to worry and get overwhelmed about changing values and trying to fiddle to find which values works the best for what. Our Algorithms will take care of all of that for you. Simply select the speeds for your Trend, Signals and Zones and you’re good to start trading! You can likewise customize what information is visible to you and the colors to better customize your experience.
Fast:
Medium:
Slow:
The 3 examples above display what the same portion of the chart looks like when Trend, Signal and Zone Sensitivity is changed from Fast, Medium and Slow.
As you can see, they all look quite different in the results they produce. By default all settings are set to Medium, however they can all be individually changed to suit your trading style and needs.
Our Indicator offers many different alert options which may help you stay informed with how the market is moving and any momentum changes that may occur.
Settings:
1. Algorithm Settings
Trend Sensitivity (Fast, Medium, Slow): Trend Sensitivity refers to how quickly the Trend Bar Colors change. Fast: will change colors very quickly if it senses momentum is changing. Medium: will change almost as quickly as Fast, however, rather than swapping from Bullish to Bearish momentum right away it has an intermediate 'Neutral - Slightly Bullish (Yellow)' and 'Neutral - Slightly Bearish (Orange)'. This way you can better visualize when the momentum is dying in the trend and starting back up by having these trend 'Neutral/Consolidation' areas. Slow: will attempt to only change Trend Bar Colors when the momentum has surely shifted. This may result in a bit of lagging behind.
Signal Sensitivity (Fast, Medium, Slow): Signal Sensitivity refers to how quickly the Buy & Sell Momentum Signals & Reversal Signals appear. These signals are meant to appear when it thinks the price may reverse, but the speeds refer to how much of a reversal they think may happen. Fast: will attempt to locate any and all momentum swings. Medium: will attempt to only locate momentum swings which may drive the price up considerably. Slow: will attempt to locate only the most extreme momentum swings. This may result in some potentially good ones missed however; but the ones it finds may have a higher probability of occuring.
Zone Sensitivity (Fast, Medium, Slow): Zone Sensitivity refers to how quickly the Zones expand based on price movement. These zones may be useful for not only seeing Support & Resistance; but also identifying when it is Overbought & Oversold; as well as visualizing volatility between the Black (Empty area) and the zones. The lines that separate each zone are the Support and Resistance locations; the area within the zones are simply the spacing between these Support and Resistance locations. However, the further the price is to the outer zones does represent Overbought and Oversold. Fast: will expand very quickly. This causes the price to be within the Black (Empty area) more often. This may be useful for finding extremities in price movement which may have a better chance of correcting. Medium: moves fast but not anywhere close to as fast as 'Fast'. Medium will hold its values in an attempt to be as accurate as possible for identifying Support and Resistance locations. Slow: will expand very slowly. This may be useful for identifying Support & Resistance as well as Volatility targets on higher time frames since these zones move much slower.
2. Display Settings:
Show Trend Bar Colors: Trend Bar Color are a way of seeing how the Trend is holding up on a bar by bar basis. This may be useful for seeing momentum starting, ending or simply dying down before any signals actually appear.
Signal Text Display (Both, Buy & Sell, Reversals, None: Signals are a way of seeing potential changes in momentum and when they have actually occurred. Our signals also rank from 1/5 to 5/5 how strong of a chance this momentum change may occur (only at the time of the signal, not at the time of the reversal). These may be useful as potential Entry and Exit locations; as well as when you see the reversal, you know that this momentum change has either begun or a consolidation may be occurring. If a consolidation occurs, the signal is no longer valid as the price can now go either way and it is best to wait for more signals or other technical analysis to determine momentum and movement.
Zone Display (All, Outer + Middle, Inner + Middle, Outer, Middle, Inner, None): Zones are composed of 3 areas above and below. These areas attempt to project Support & Resistance locations as well as display when the Price is Overbought and Oversold. You can specify which zones you wish to view, however all are important.
3. Color Settings:
Buy Color: This is the color of all Buy Signals and Zones.
Sell Color: This is the color of all Sell Signals and Zones.
Buy Reversal Color: This is the color of all Buy Signal Reversals.
Sell Reversal Color: This is the color of all Sell Signal Reversals.
If you have any questions, comments, ideas or concerns please don't hesitate to contact us.
HAPPY TRADING!

Gorb AlgoIntroduction:
Gorb Algo is an all-in-one trading indicator made up of classic technical analysis components such as moving averages, relative strength index, stochastic oscillator, and pivot points blended together to create a synergistic algorithm. Focused on providing useful signals & trading tool overlays to meet all trader's technical analysis needs. Each feature included can be changed to meet each traders strategy or market condition.
Overview:
The Gorb Market Trend isn't a simple trend-following tool; it's a sophisticated blend of traditional and innovative methods, providing comprehensive market analysis.
Its unique combination of EMA analysis, volume weighting, RSI, and stochastic indicators, along with proprietary algorithms, providing nuanced views in trend detection and trading confluences.
The indicator is designed for traders at all levels, offering a balance of depth for experienced traders and simplicity for beginners.
Centerpieces: Gorb Market Trend & Volume Strength
These use a color-coded system to indicate market direction/strength. The color: white is used to signal upward/bullish trend, while the color: purple is used to signal downward/bearish trend. It is designed for ease of use, simplifying complex market data into an easy visually understandable format.
How the Gorb Market Trend Works:
Moving averages are used to find convergence or divergence on multiple EMA's to help determine the overall market direction. Relative Strength Index is used to assess the speed and change of price movements to add another layer to the Market Trend lines identification of the markets analysis. It then plots a line using just two colors to provide traders with a visual representation of the trend. This can help traders quickly grasp the current market trend with simple color cues.
How the Volume Strength Works:
A stochastic oscillator is used to measure the current price level relative to its price over a specific range period to capture sentiment and potential reversals for the Trend Strength feature. And the final part is the use of VWAP and volume analysis to ensure that identified trends are not only based on price movements but are also supported by trading volume, adding a layer of reliability to the trend signals. These are then plotted at the bottom of the chart following the same color scheme as Gorb Market Trend. Only difference is, when volume strength begins to decline, the color will be more transparent, and when it is strong, the color will be bright.
Custom Algorithmic Elements:
The Gorb Market Trend isn't just a combination of standard indicators. It includes proprietary algorithmic elements tailored to enhance signal accuracy and timing. These unique components are what set the Gorb Market Trend apart from conventional trend-detection methods.
We recommend exploring every feature to pick & choose what best suits your needs and style of trading, and use that to combine with the Market trend line.
Features:
All skill-level friendly presets, easy to enable features with one-click
Trading Signals: Plotted signals to help traders identify changes in trend on the Gorb Market Trend Line (not to be followed blindly)
Match Volume Color: allows the user to enable signals to appear only if they match the trend strength's color
Enable MA Filter: allows the user to use 2 EMA's to create a custom trend filter in order to limit contrarian signals with the current trend
Chop Filter: allows the user to have a specific candle range of their choice to limit signals during sideways price movement
4 EMA's: allows the user to plot up to 4 EMA's on the chart and change to the users specific trading strategy with the Market Trend line
VWAP: allows users to plot VWAP on their chart to visually see where price is relatively
EMA Clouds: allows users to fill the gap between EMA's plotted on the chart to help them visualize zones for entries or stop-losses
Pivot Points: allows users to have pivots on their chart to use in tandem with market trend line to find areas of support and resistance to help find confluence in their trading
All colors are changeable for the user to customize the scheme to their liking or style
Basic Signals, Market Trend & Volume Strength Demonstration
In the image below, we can see a basic example of how these 3 core features function.
As explained above, the trade ideas are only generated if the user enables them. They will plot as small triangles in real time and are directly correlated to the market trend line coloring in order to quickly see the change in market conditions.
The volume strength on the bottom helps identify the strength and momentum of the market condition. This can also be used to identify possible fake-outs or small pullbacks before price continues on. The brighter the volume strength the stronger it is, when it is dimmer, that means volume is decreasing in that direction. This can help traders identify signals they may not want to trust as much.
Trading Tool Overlays with Signals
In the image below, we have enabled the EMA's and VWAP overlays from the settings. By using these tools, users can add more confluence to create their trading strategies
The EMA's are not only used for the market trends, trend filter. But also used as an additional confluence for general trend following purposes alongside the trade idea signals. These can be extremely useful for traders who like to have different length moving averages depending on their timeframe for analyzing the market.
In this next image, we can see that price dips down and then bounces up. With EMA clouds enabled, the user can now have visual zones to look for trade entries in.
When paired with the market trend line and trade idea signals, this adds a whole other level of easy visual trading confluence for traders. You can see that market trend changes color and a trade signal is plotted when price enters these zones. This can be helpful to a trader looking to find confluence in their entries.
The image below shows specific pivot levels being plotted when the user enabled pivots in the settings of the indicator.
The pivot levels proved an excellent area of support/resistance for traders that are generated fresh every day. These are particularly useful for areas that line up with previous tools above and trade signals. This overlay gives traders a clear level that can be used to confirm entries and create targets to exit trades at. These levels when combined with the other tools in this indicator provide traders an all-in-one visual confluences. Some traders may just use this overlay to have an idea on the range for the trading session.
Filters:
There are 3 different trade signal filters integrated into this indicator
1. Match Volume Color: When enabled, signals can only be valid and plotted if the volume strength color matches the market trend line signal. Otherwise the signal will not appear, this limits possible fake-outs without having volume agree.
2. MA Filter: When enabled, this removes an contrarian signals to the current market trend per the settings of the filter. The EMA settings for this filter can be changed by the user for them to customize this to their trading strategies. There are two settings, short ema and long ema to define the trend.
3. Chop Filter: When enabled, this disables signals that would normally appear in sideways price action. This setting is also customizable by the user; there are two settings: candle period and threshold. The candle period is how many candles back does this filter want to look to define its range. The threshold, is the amount of price deviation is allowed from this range in order to disable a signal.
Conclusion:
We believe in providing an all inclusive trading tool to help simplify trading for all traders. The goal is to provide a user-friendly, efficient tool that provides insights into market trends. For it to stand out for its simplicity and effectiveness, as a support tool for decision making.
How to get access:
You can see the Author's instructions to get access to this indicator
RISK DISCLAIMER
All content, tools, scripts & education provided by Monstanzer or Gorb Algo LLC are for informational & educational purposes only. Trading is risk and most lose their money, past performance does not guarantee future results.
Currency Pair Strategy [ICEALGO]Indicator for trading with currency pairs
Get Access to ICEALGO indicators: icealgo.com
All scripts & content provided by ICEALGO are for informational & educational purposes only. Past performance does not guarantee future results.

TrapZone ProThis script combines the concepts of Price Action, Trend and Momentum to identify Price Zones (Red and Green filled areas) and Price Bars (Red, Green and Gray) where traders can get trapped in the Market.
It will clearly mark the bars which favor the prevailing Trend and those bars which just don't have the momentum anymore. TrapZone moves with the market trend and will often provide it support. As the TrapZone changes direction & its color, traders can change their trade bias.
Features:
Identify strong & weak price action - By leveraging a regression calculation of price movement on Y axis against the x axis, we identify the strength of current bars. Increasing relative strength of bars indicate Bullish (Green Bars) & Bearish (Red Bars) price movement, respectively. As the relative strength starts to decrease in Bullish or Bearish price action, the indicator immediately changes the color of these bars to Gray (by default). We call these TrapBars .
Current price trend - By using the highs and lows of price in multiple periods, we are calculating the trend of the price. The Bullish trend is shown by the Green zone and Bearish trend is shown by the Red zone. These zones are the shaded areas which are plotted on the chart. If the price is in these Zones, Longs or Short trades are not advised as that price action is weak. We call these TrapZones .
Strength of the Momentum - the thickness of the TrapZone shows the strength of the current Bullish or Bearish trend. That means the wider the shaded area grows the stronger is the current market momentum. A Flat TrapZone indicates sideways price action.
Knowing when NOT to Trade is as important as when to Trade. While this indicator is designed to avoid taking bad trades such as FOMO, Catching a Falling Knife or Fighting The Trend , it successfully reveals the good trade setups!
How these features of this indicator helps Traders avoids common mistakes:
FOMO or Fear of Missing Out - If a Trader Sees TrapBars in a Bullish or Bearish Trend, they will avoid entry as the price action is weak at that time. This will avoid late entries.
Catching a Falling Knife (a.k.a. Picking a Bottom) - When Red TrapZone is being plotted, Traders can avoid taking Long Entries hoping for a price reversal.
Fighting The Trend (a.k.a Picking a Top) - When Green TrapZone is being plotted, Traders can avoid taking Short entries hoping for a price reversal.
TrapZone Pro does all this in a single panel of the chart irrespective of the market or timeframe.
How to use TrapZone Pro indicator for trading [
A. Market Analysis
Green TrapZone is Bullish and traders should not take Shorts. If Green TrapZone is moving higher, Market is Strong
Red TrapZone is Bearish and traders should not take Longs. If Red TrapZone is moving Lower, Market is Strong
No trades when TrapBars are forming
No trades inside the TrapZone
B. Trade Guidance System
Establish Market Bias - Bullish or Bearish using the TrapZone Color
Only Enter Long in Long Color Bars i.e. Green by default
Only Enter Short in Short Color Bars i.e. Red by default
3 Classes of Trades are Possible Class A, B & C. A being the best Reward : Risk ratio and C being the least rewarding. So use trade size accordingly.
Class A - Best bars are always the first & Second, close to the TrapZone
Class B - Long Bar or Short Bar Forming after TrapBar away from the TrapZone in a Strong Market
Class C - Long Bar or Short Bar Forming after TrapBar close to the TrapZone in a Flat Market (identified by Flat TrapZone )
Take profits when Price moves away from the TrapZone & TrapBars start forming OR Your Target is hit !
See a few examples of Trade Classes & Entries/ Exits for a better understanding
Recommendations
Select Session to “Electronic Trading Hours” in chart settings so you can see the Post & Pre Market trading as well. You can change the color of these sessions to the same color as chart background, so it is not distracting.
Start by Trading in the Hourly or Daily time frame to get used to the new indicator and its Trade Guidance System .
Position Size is the best form of Risk Management. Have a fixed dollar loss per trade pre-determined and adjust the size based on market volatility.
Even though this indicator is designed to work on any market or timeframe, trade the markets that you are familiar with and timeframe that matches your lifestyle. Your understanding of the instrument's behavior and knowledge of what makes it move is valuable.
Basic Set-Up
Add the Indicator to the chart
Open Chart Settings and in Symbol Section
Switch off “ Borders ”
Switch off “ Wick ” or Change the colors to a same non-distracting color like Black or Gray
Open TrapZone Pro Settings
Set the colors for the “ Long Bars ”, “ Short Bars ” & “ No Entry Bars ” if you wish to change the default colors
Change “ TrapZone ” colors to your Taste or leave the defaults
Green for “Color 0” that represents Bullish Price Action
Red for “Color 1” that represents Bearish Price Action
Important Advice & Disclaimer: This indicator does not guarantee that you will make money. It is a tool that performs market analysis for you and presents it in a easy to consume fashion. Markets are truly random and can change direction on a dime. You must use prudent risk and money management strategy based on your investor profile, investment objectives and risk appetite.
To Get Access - See Author’s instructions below

Trade size calculatorThis script will calculate recommended Trade Size based on your Risk appetite, Trading style and Current market volatility. Once you input “ RiskPerTrade ” amount, It automatically adjusts recommended Trade Size for changes in markets behavior. You have an option to select “ Long Term ”, “ Short Term ” & “ Intraday ” as your Trade Type. Your Rec Size (Trade Size) will be calculated and printed on you chart.
How it works:
It calculates recommended trade size using your accepted risk ( RiskPerTrade input) and instruments current average price range.
It uses different multipliers to adjust the trade size based on your Trade Type .
Intraday trades are assumed to be closed within the same trading session and therefore will have the highest recommended size.
Short Term trades assume the overnight risk added to the positions and recommend a lower size.
Long Term trades assume overnight & weekend risk added to the position and therefore recommend the smallest size.
Your Trade Size is the key to Risk Management. This Indicator is simple but powerful when used with a good Portfolio Management Strategy. Just add the indicator to your chart and configure its inputs as per your trade plan.
How to configure the Indicator
Input 1 - Add RiskPerTrade amount
Input 2 - Select your Trade Type
Input 3 - Add a negative number in BarsRight to position the label in the desired location of your screen.
Important Display Setting - “ BarsRight ” Input - If you CAN'T SEE the Yellow Label on the chart after you added the indicator, set this number to a large negative no. for example -200 and then adjust the number to get the label positioned where you would like. This happens due to various screen formats and resolutions.
Please note: This indicator is designed for Equities, Stocks or ETFs only. For users in markets not priced in US dollar, make sure your instrument’s price and your RiskPerTrade amount are in the same currency.

ICT Kill Zones [dR-Algo]ICT Kill Zones Indicator by dR-Algo
Introducing the dR-Algo's ICT Kill Zones Indicator – a tool meticulously crafted to blend with the elegance of the ICT Concept of Kill Zones. Built for traders who seek clarity and focus, this unique indicator is tailored to highlight the essential time frames while ensuring minimal distraction from the core price action.
Key Features:
Three Kill Zones:
London Kill Zone: Kickstart your trading day with the London Kill Zone, highlighting the critical period between 03:00 to 04:00 (UTC-4). The London session, known for its volatility due to the overlapping of the Asian session, is captured precisely for your benefit.
NY AM Session: As the European markets gear towards close and the US markets come alive, our indicator emphasizes the activity from 10:00 to 11:00 (UTC-4). It’s a window where significant market moves often originate.
NY PM Session: Capture the late-day trading action between 14:00 to 15:00 (UTC-4). As markets prepare to close, this time frame can offer last-minute opportunities.
Subtle Yet Effective Visualization: Unlike many other indicators that bombard traders with an array of colors, our ICT Kill Zones Indicator is intentionally designed to be subtle. It provides just the right amount of visual emphasis without overwhelming the chart. The primary goal is to let traders focus on what truly matters: the price action.
User-Friendly Customization: The indicator's settings can be easily tailored to align with individual trading styles, allowing traders to adjust and tweak as per their preference.
Seamless Integration with Trading View: Smoothly integrates with your TradingView charts ensuring optimal performance and real-time responsiveness.
Why Choose Our ICT Kill Zones Indicator?
The market is flooded with indicators, each promising to be the 'next big thing.' What sets dR-Algo's ICT Kill Zones Indicator apart is its dedication to simplicity and effectiveness. It's not just about adding an indicator to your chart; it's about adding value to your trading experience. By seamlessly merging vital time frames without overshadowing the price action, we ensure traders get the best of both worlds.
Join the trading revolution with dR-Algo and embrace a focused approach to the markets.

Flux Charts SFX Algo (Premium)Flux Charts SFX Algo indicator is a comprehensive and sophisticated all-in-one toolkit designed to cater to all the technical analysis needs of traders. Developed and designed by Russell W., head developer at Flux Charts.
The Flux Charts SFX Algo indicator stands apart with its unique ability to seamlessly integrate with various forms of technical analysis, while also offering the option to function as a standalone toolkit adaptable to any trading style. The indicator has been designed to take into account the dynamic nature of market conditions, ensuring that every feature included remains relevant, reliable, and effective.
Traders have countless possibilities when utilizing this indicator, allowing for the exploration and analysis of an array of cutting-edge features over time. This enables traders to selectively employ the features that align best with their individual trading styles and build a personal trading strategy.
The Flux Charts SFX Algo indicator is set to revolutionize the way traders approach technical analysis, providing them with the tools and insights needed to navigate complex financial markets with confidence and precision.
Flux Charts SFX Algo works in all markets (stocks, crypto, forex, futures, bonds, options, etc) and has many features including:
Buy signals (Not to be followed blindly)
Sell signals (Not to be followed blindly)
Buy & Sell Signal Ratings (Higher rating doesn't necessarily mean a "better" signal)
Algorithm Weighting Customization
Algorithm Sensitivity Customization
Algorithm Signal Strength Filter
Take Profit signals
Take Profit Retest signals
Take Profit Level Optimization
Trend Candle Coloring
Volatility Bands
+ more
What it does
The indicator uses an Adjusted Weighted majority algorithm to generate "buy" and "sell" signals. The algorithm takes into account several market metrics and weights them based on their recent performance. How far back the algorithm checks is based on the “Time Weighting” setting. This allows users to choose between having more data points or having more recency bias within the algorithm, but less data to decipher.
How it works and what differentiates it
There are many popular strategies in the market all of which go in and out of successful periods. The SFX algorithm effectively uses popular indicators or "experts" and weights them using a period decided through the "Time Weighting" Setting. The "experts" include popular indicators that cover Momenutmn, ATR trends, and EMA trends. Adjusted Weighted Majority typically weighs only through binary events however the SFX also uses a dynamic system to punish larger losses. The total weighting is then used to confirm a signal is agreeing with the most successful "experts" or indicators within the time period. This effectively will filter poor signals during periods of underperformance compared to other indicators and the converse during performant periods.
This weighting algorithm was inspired by the Princeton University lecture "Multiplicative Weight Algorithm" by Sanjeev Arora!
Usage
CME_MINI:ES1! 3 minute timeframe, July 7 2023.
Indicator Settings: (Sensitivity: 70, Signal Strength: 40, Time Weighting: Recent Trends)
The star-rated signals show the strength of the signals based on our weighting system
The colored candles (green & red) simplify the market into basic uptrends/downtrends
The volatility bands show areas of potential reversals
The volatility bands also show potential breakouts (Tight bands = consolidation, which could lead to an impulsive move)
The take profit signals suggest areas where profits should be taken in a trade
Settings and their Usage
Algorithm Settings Explained
Sensitivity determines how frequently signals appear. A higher sensitivity would lead to more frequent signals (Buy & Sell) appearing on your chart
Signal Strength helps filter out low-rated signals based on our Stochastic Weighting Algorithm. A higher signal strength will lead to fewer signals on your chart. A higher-rated signal doesn't necessarily make it a better signal than a lower-rated signal.
Time Weighting allows you to choose how much historic data you want the indicator to use when interpreting data for the signals. There are three options to choose from including:
- Recent Trends
- Mixed Trends
- Longterm Trends
Using the "Recent Trends" option will only use recent market data when looking at the market metrics our algorithm uses for generating "Buy" and "Sell" signals. Thus, there will be a recency bias which means the metrics the algorithm is weighing more heavily have recently performed well.
Using the "Longterm Trends" option will use more historic market data when looking at the market metrics our algorithm uses. This will give more data points for the algorithm to use, but it won't count for recent performances, but rather an overall performance in the past. Thus, if one metric has been doing poorly recently, it will still receive the same weight, even though it was performing well at the start of our lookback period for data.
Using the "Mixed Trends" option will give you a choice that is in between these two options. This will give you a good balance between having enough data points for market metrics, while also sustaining a good bit of market recency bias.

Quantitative Trend Strategy- Uptrend longTrend Strategy #1
Indicators:
1. SMA
2. Pivot high/low functions derived from SMA
3. Step lines to plot support and resistance based on the pivot points
4. If the close is over the resistance line, green arrows plot above, and vice versa for red arrows below support.
Strategy:
1. Long Only
2. Mutable 2% TP/1.5% SL
3. 0.01% commission
4. When the close is greater than the pivot point of the sma pivot high, and the close is greater than the resistance step line, a long position is opened.
*At times, the 2% take profit may not trigger IF; the conditions for reentry are met at the time of candle closure + no exit conditions have been triggered.
5. If the position is in the green and the support step line crosses over the resistance step line, positions are exited.
How to use it and what makes it unique:
Use this strategy to trade an up-trending market using a simple moving average to determine the trend. This strategy is meant to capture a good risk/reward in a bullish market while staying active in an appropriate fashion. This strategy is unique due to it's inclusion of the step line function with statistics derived from myself.
This description tells the indicators combined to create a new strategy, with commissions and take profit/stop loss conditions included, and the process of strategy execution with a description on how to use it. If you have any questions feel free to PM me and boost if you enjoyed it. Thank you, pineUSERS!
