ADX_RDADX_RD - Average Directional Index (Ryan DeBraal)
This script plots a refined version of the **ADX (Average Directional Index)**,
used to measure trend strength regardless of trend direction. It includes
custom smoothing, modified DM (Directional Movement) logic, dynamic coloring,
and a built-in 20-level threshold.
FEATURES
- Calculates +DI, –DI, and ADX using standard Wilder smoothing (RMA).
- Signal color turns **white** when ADX < 20 (low-trend or choppy conditions).
- Signal color turns **blue** when ADX >= 20 (trend strengthening).
- Horizontal dotted reference line at **20**, a widely used threshold:
ADX < 20 → weak or ranging market
ADX > 20 → strengthening trend
- Works on all timeframes, supports custom smoothing lengths.
PURPOSE
This indicator helps identify when a market is trending vs when it is flat.
It does not indicate direction by itself — only the strength of the move —
making it ideal for confirming breakout setups, trend-following entries,
and filtering out low-probability trades during chop.
ADX

The Oracle: Dip & Top Adaptive Sniper [Hakan Yorganci]█ OVERVIEW
The Oracle: Dip & Top Adaptive Sniper is a precision-focused trend trading strategy designed to solve the biggest problem in swing trading: Timing.
Most trend-following strategies chase price ("FOMO"), buying when the asset is already overextended. The Oracle takes a different approach. It adopts a "Sniper" mentality: it identifies a strong macro trend but patiently waits for a Mean Reversion (pullback) to execute an entry at a discounted price.
By combining the structural strength of Moving Averages (SMA 50/200) with the momentum precision of RSI and the volatility filtering of ADX, this script filters out noise and targets high-probability setups.
█ HOW IT WORKS
This strategy operates on a strictly algorithmic protocol known as "The Yorganci Protocol," which involves three distinct phases: Filter, Target, and Execute.
1. The Macro Filter (Trend Identification)
* SMA 200 Rule: By default, the strategy only scans for buy signals when the price is trading above the 200-period Simple Moving Average. This ensures we are always trading in the direction of the long-term bull market.
* Adaptive Switch: A new feature allows users to toggle the Only Buy Above SMA 200? filter OFF. This enables the strategy to hunt for oversold bounces (dead cat bounces) even during bearish or neutral market structures.
2. The Volatility Filter (ADX Integration)
* Sideways Protection: One of the main weaknesses of moving average strategies is "whipsaw" losses during choppy, ranging markets.
* Solution: The Oracle utilizes the ADX (Average Directional Index). It will BLOCK any trade entry if the ADX is below the threshold (Default: 20). This ensures capital is only deployed when a genuine trend is present.
3. The Sniper Entry (Buying the Dip)
* Instead of buying on breakout strength (e.g., RSI > 60), The Oracle waits for the RSI Moving Average to dip into the "Value Zone" (Default: 45) and cross back up. This technique allows for tighter stops and higher Risk/Reward ratios compared to traditional breakout systems.
█ EXIT STRATEGY
The Oracle employs a dynamic dual-exit mechanism to maximize gains and protect capital:
* Take Profit (The Peak): The strategy monitors RSI heat. When the RSI Moving Average breaches the Overbought Threshold (Default: 75), it signals a "Take Profit", securing gains near the local top before a potential reversal.
* Stop Loss (Trend Invalidated): If the market structure fails and the price closes below the 50-period SMA, the position is immediately closed to prevent deep drawdowns.
█ SETTINGS & CONFIGURATION
* Moving Averages: Fully customizable lengths for Support (SMA 50) and Trend (SMA 200).
* Trend Filter: Checkbox to enable/disable the "Bull Market Only" rule.
* RSI Thresholds:
* Sniper Buy Level: Adjustable (Default: 45). Lower values = Deeper dips, fewer trades.
* Peak Sell Level: Adjustable (Default: 75). Higher values = Longer holds, potentially higher profit.
* ADX Filter: Checkbox to enable/disable volatility filtering.
█ BEST PRACTICES
* Timeframe: Designed primarily for 4H (4-Hour) charts for swing trading. It can also be used on 1H for more frequent signals.
* Assets: Highly effective on trending assets such as Bitcoin (BTC), Ethereum (ETH), and high-volume Altcoins.
* Risk Warning: This strategy is designed for "Long Only" spot or leverage trading. Always use proper risk management.
█ CREDITS
* Original Concept: Inspired by the foundational work of Murat Besiroglu (@muratkbesiroglu).
* Algorithm Development & Enhancements: Developed by Hakan Yorganci (@hknyrgnc).
* Modifications include: Integration of ADX filters, Mean Reversion entry logic (RSI Dip), and Dynamic Peak Profit taking.

ADX Forecast Colorful [DiFlip]ADX Forecast Colorful
Introducing one of the most advanced ADX indicators available — a fully customizable analytical tool that integrates forward-looking forecasting capabilities. ADX Forecast Colorful is a scientific evolution of the classic ADX, designed to anticipate future trend strength using linear regression. Instead of merely reacting to historical data, this indicator projects the future behavior of the ADX, giving traders a strategic edge in trend analysis.
⯁ Real-Time ADX Forecasting
For the first time, a public ADX indicator incorporates linear regression (least squares method) to forecast the future behavior of ADX. This breakthrough approach enables traders to anticipate trend strength changes based on historical momentum. By applying linear regression to the ADX, the indicator plots a projected trendline n periods ahead — helping users make more accurate and timely trading decisions.
⯁ Highly Customizable
The indicator adapts seamlessly to any trading style. It offers a total of 26 long entry conditions and 26 short entry conditions, making it one of the most configurable ADX tools on TradingView. Each condition is fully adjustable, enabling the creation of statistical, quantitative, and automated strategies. You maintain full control over the signals to align perfectly with your system.
⯁ Innovative and Science-Based
This is the first public ADX indicator to apply least-squares predictive modeling to ADX dynamics. Technically, it embeds machine learning logic into a traditional trend-strength indicator. Using linear regression as a predictive engine adds powerful statistical rigor to the ADX, turning it into an intelligent, forward-looking signal generator.
⯁ Scientific Foundation: Linear Regression
Linear regression is a fundamental method in statistics and machine learning used to model the relationship between a dependent variable y and one or more independent variables x. The basic formula for simple linear regression is:
y = β₀ + β₁x + ε
Where:
y = predicted value (e.g., future ADX)
x = explanatory variable (e.g., bar index or time)
β₀ = intercept
β₁ = slope (rate of change)
ε = random error term
The goal is to estimate β₀ and β₁ by minimizing the sum of squared errors. This is achieved using the least squares method, ensuring the best linear fit to historical data. Once the coefficients are calculated, the model extends the regression line forward, generating the ADX projection based on recent trends.
⯁ Least Squares Estimation
To minimize the error, the regression coefficients are calculated as:
β₁ = Σ((xᵢ - x̄)(yᵢ - ȳ)) / Σ((xᵢ - x̄)²)
β₀ = ȳ - β₁x̄
Where:
Σ = summation
x̄ and ȳ = means of x and y
i ranges from 1 to n (number of data points)
These formulas provide the best linear unbiased estimator under Gauss-Markov conditions — assuming constant variance and linearity.
⯁ Linear Regression in Machine Learning
Linear regression is a foundational algorithm in supervised learning. Its power in producing quantitative predictions makes it essential in AI systems, predictive analytics, time-series forecasting, and automated trading. Applying it to the ADX essentially places an intelligent forecasting engine inside a classic trend tool.
⯁ Visual Interpretation
Imagine an ADX time series like this:
Time →
ADX →
The regression line smooths these values and projects them n periods forward, creating a predictive trajectory. This forecasted ADX line can intersect with the actual ADX, offering smarter buy and sell signals.
⯁ Summary of Scientific Concepts
Linear Regression: Models variable relationships with a straight line.
Least Squares: Minimizes prediction errors for best fit.
Time-Series Forecasting: Predicts future values using historical data.
Supervised Learning: Trains models to predict outcomes from inputs.
Statistical Smoothing: Reduces noise and highlights underlying trends.
⯁ Why This Indicator Is Revolutionary
Scientifically grounded: Based on rigorous statistical theory.
Unprecedented: First public ADX using least-squares forecast modeling.
Smart: Uses machine learning logic.
Forward-Looking: Generates predictive, not just reactive, signals.
Customizable: Flexible for any strategy or timeframe.
⯁ Conclusion
By merging ADX and linear regression, this indicator enables traders to predict market momentum rather than merely follow it. ADX Forecast Colorful is not just another indicator — it’s a scientific leap forward in technical analysis. With 26 fully configurable entry conditions and smart forecasting, this open-source tool is built for creating cutting-edge quantitative strategies.
⯁ Example of simple linear regression with one independent variable
This example demonstrates how a basic linear regression works when there is only one independent variable influencing the dependent variable. This type of model is used to identify a direct relationship between two variables.
⯁ In linear regression, observations (red) are considered the result of random deviations (green) from an underlying relationship (blue) between a dependent variable (y) and an independent variable (x)
This concept illustrates that sampled data points rarely align perfectly with the true trend line. Instead, each observed point represents the combination of the true underlying relationship and a random error component.
⯁ Visualizing heteroscedasticity in a scatterplot with 100 random fitted values using Matlab
Heteroscedasticity occurs when the variance of the errors is not constant across the range of fitted values. This visualization highlights how the spread of data can change unpredictably, which is an important factor in evaluating the validity of regression models.
⯁ The datasets in Anscombe’s quartet were designed to have nearly the same linear regression line (as well as nearly identical means, standard deviations, and correlations) but look very different when plotted
This classic example shows that summary statistics alone can be misleading. Even with identical numerical metrics, the datasets display completely different patterns, emphasizing the importance of visual inspection when interpreting a model.
⯁ Result of fitting a set of data points with a quadratic function
This example illustrates how a second-degree polynomial model can better fit certain datasets that do not follow a linear trend. The resulting curve reflects the true shape of the data more accurately than a straight line.
⯁ What is the ADX?
The Average Directional Index (ADX) is a technical analysis indicator developed by J. Welles Wilder. It measures the strength of a trend in a market, regardless of whether the trend is up or down.
The ADX is an integral part of the Directional Movement System, which also includes the Plus Directional Indicator (+DI) and the Minus Directional Indicator (-DI). By combining these components, the ADX provides a comprehensive view of market trend strength.
⯁ How to use the ADX?
The ADX is calculated based on the moving average of the price range expansion over a specified period (usually 14 periods). It is plotted on a scale from 0 to 100 and has three main zones:
Strong Trend: When the ADX is above 25, indicating a strong trend.
Weak Trend: When the ADX is below 20, indicating a weak or non-existent trend.
Neutral Zone: Between 20 and 25, where the trend strength is unclear.
⯁ Entry Conditions
Each condition below is fully configurable and can be combined to build precise trading logic.
📈 BUY
🅰️ Signal Validity: The signal will remain valid for X bars .
🅰️ Signal Sequence: Configurable as AND or OR .
🅰️ +DI > -DI
🅰️ +DI < -DI
🅰️ +DI > ADX
🅰️ +DI < ADX
🅰️ -DI > ADX
🅰️ -DI < ADX
🅰️ ADX > Threshold
🅰️ ADX < Threshold
🅰️ +DI > Threshold
🅰️ +DI < Threshold
🅰️ -DI > Threshold
🅰️ -DI < Threshold
🅰️ +DI (Crossover) -DI
🅰️ +DI (Crossunder) -DI
🅰️ +DI (Crossover) ADX
🅰️ +DI (Crossunder) ADX
🅰️ +DI (Crossover) Threshold
🅰️ +DI (Crossunder) Threshold
🅰️ -DI (Crossover) ADX
🅰️ -DI (Crossunder) ADX
🅰️ -DI (Crossover) Threshold
🅰️ -DI (Crossunder) Threshold
🔮 +DI (Crossover) -DI Forecast
🔮 +DI (Crossunder) -DI Forecast
🔮 ADX (Crossover) +DI Forecast
🔮 ADX (Crossunder) +DI Forecast
📉 SELL
🅰️ Signal Validity: The signal will remain valid for X bars .
🅰️ Signal Sequence: Configurable as AND or OR .
🅰️ +DI > -DI
🅰️ +DI < -DI
🅰️ +DI > ADX
🅰️ +DI < ADX
🅰️ -DI > ADX
🅰️ -DI < ADX
🅰️ ADX > Threshold
🅰️ ADX < Threshold
🅰️ +DI > Threshold
🅰️ +DI < Threshold
🅰️ -DI > Threshold
🅰️ -DI < Threshold
🅰️ +DI (Crossover) -DI
🅰️ +DI (Crossunder) -DI
🅰️ +DI (Crossover) ADX
🅰️ +DI (Crossunder) ADX
🅰️ +DI (Crossover) Threshold
🅰️ +DI (Crossunder) Threshold
🅰️ -DI (Crossover) ADX
🅰️ -DI (Crossunder) ADX
🅰️ -DI (Crossover) Threshold
🅰️ -DI (Crossunder) Threshold
🔮 +DI (Crossover) -DI Forecast
🔮 +DI (Crossunder) -DI Forecast
🔮 ADX (Crossover) +DI Forecast
🔮 ADX (Crossunder) +DI Forecast
🤖 Automation
All BUY and SELL conditions are compatible with TradingView alerts, making them ideal for fully or semi-automated systems.
⯁ Unique Features
Linear Regression: (Forecast)
Signal Validity: The signal will remain valid for X bars
Signal Sequence: Configurable as AND/OR
Condition Table: BUY/SELL
Condition Labels: BUY/SELL
Plot Labels in the Graph Above: BUY/SELL
Automate and Monitor Signals/Alerts: BUY/SELL
Background Colors: "bgcolor"
Background Colors: "fill"
Linear Regression (Forecast)
Signal Validity: The signal will remain valid for X bars
Signal Sequence: Configurable as AND/OR
Table of Conditions: BUY/SELL
Conditions Label: BUY/SELL
Plot Labels in the graph above: BUY/SELL
Automate & Monitor Signals/Alerts: BUY/SELL
Background Colors: "bgcolor"
Background Colors: "fill"

Low Volatility Profiles [BigBeluga]🔵 OVERVIEW
Low Volatility Profiles is a market compression and breakout-anticipation tool that identifies phases of low volatility using ADX and then builds a real-time volume profile inside the detected range.
This helps traders spot accumulation/distribution zones and prepare for explosive moves when volatility expands.
When volatility is low ➜ price coils ➜ volume organizes ➜ breakouts become highly actionable.
This tool visualizes that process with dynamic range boxes + volume bins + PoC extension.
🔵 CONCEPTS
Low-Volatility Detection — Uses ADX threshold & cross logic to define volatility contraction regimes.
Range Construction — Draws a price box that expands with highs/lows during the compression phase.
Micro Volume Profile — Builds a volume histogram inside the range using bins (micro volume nodes).
Delta Calculation — Tracks positive vs negative volume to gauge buyer/seller pressure within range.
Point of Control (PoC) — Highlights the price level with max traded volume inside the range.
PoC Extension — Optionally extends PoC into future bars to show potential reaction zone after breakout.
Breakout Validation — Ends the profile zone when price breaks above or below the modeled range.
Noise Removal — Automatically removes invalid or small ranges to prevent chart clutter.
This tool turns consolidation into actionable structure by exposing where smart money accumulates before trending moves.
🔵 FEATURES
ADX-Driven Range Detection — Identify when market transitions into low-volatility compression.
Configurable ADX Threshold — Set sensitivity for contraction zones.
Cross-Type Option — Detect low volatility via cross under / crossover logic.
Dynamic Range Box — Expands live with price as contraction unfolds.
Micro Volume Profile (Bins) — Distributes volume across bins inside range for micro POC mapping.
Volume Delta Visualization — Shows imbalance inside consolidation (accumulation vs distribution).
Real-Time PoC Highlight — Instantly shows most traded price inside the compression.
PoC Extension Mode — Extend PoC forward to project reaction levels post-breakout.
Clean Auto-Reset Logic — Removes boxes if range invalid or breakout occurs too fast.
Optional Filled Boxes — Heatmap-style profile visualization inside range body.
ADX Line + Threshold Plot — Visual assistance for volatility state monitoring.
🔵 HOW TO USE
Identify Accumulation Zones — When price enters low-volatility ADX condition and profile builds.
Watch the PoC — PoC acts as battle zone; move above/below can signal initiator strength.
Breakout Strategy — Trade break above/below the range after compression.
Mean Reversion Inside Range — Fade edges while price remains inside compression box.
Combine With Trend Tools — Use trend confirmation (MA/EMA/Flow indicators) after breakout.
Use Delta Clues — Positive delta tilt suggests accumulation; negative suggests distribution.
Monitor Range Size — Longer build + high PoC volume = stronger potential breakout energy.
🔵 CONCLUSION
Low Volatility Profiles isolates accumulation phases and maps volume concentration before volatility expansion.
By combining ADX compression, micro volume distribution, and PoC tracing, traders gain an edge in anticipating powerful breakout cycles and institutional positioning.
Trade the quiet moment before the storm — where smart money prepares the move, and the real opportunity emerges.

EMA 12-26-100 Momentum Strategy# Triple EMA Multi-Signal Momentum Strategy
## 📊 Overview
**Triple EMA Multi-Signal** is a comprehensive trend-following momentum strategy designed specifically for cryptocurrency markets. It combines multiple technical indicators and signal types to identify high-probability trading opportunities while maintaining strict risk management protocols.
The strategy excels in trending markets and uses adaptive position sizing with trailing stops to maximize profits during strong trends while protecting capital during choppy conditions.
## 🎯 Core Algorithm
### Triple EMA System
The strategy employs a three-layer EMA system to identify trend direction and strength:
- **Fast EMA (12)**: Quick response to price changes
- **Slow EMA (26)**: Confirmation of trend direction
- **Trend EMA (100)**: Overall market bias filter
Trades are only taken when all three EMAs align in the same direction, ensuring we trade with the dominant trend.
### Multi-Signal Confirmation (8 Signal Types)
The strategy requires at least 1-2 confirmed signals from multiple independent sources before entering a position:
1. **EMA Crossover** - Fast EMA crossing Slow EMA (primary signal)
2. **MACD Cross** - MACD line crossing signal line (momentum confirmation)
3. **RSI Reversal** - RSI bouncing from oversold/overbought zones
4. **Price Action** - Strong bullish/bearish candles (>60% of range)
5. **Volume Spike** - Above-average volume confirmation
6. **Breakout** - Price breaking 20-period high/low with volume
7. **Pullback to EMA** - Trend continuation after healthy retracement
8. **Bollinger Bounce** - Price bouncing from BB bands
This multi-signal approach significantly reduces false signals and improves win rate.
## 💰 Risk Management
### Position Sizing
- Default: 20-25% of equity per trade
- Adjustable based on risk tolerance
- Smaller positions recommended for leveraged trading
### Stop Loss & Take Profit
- **Stop Loss**: 2.0% (tight control of risk)
- **Take Profit**: 5.5% (2.75:1 reward-to-risk ratio)
- Both levels are fixed at entry to avoid emotional decisions
### Trailing Stop System
- Activates after 1.8% profit
- Trails at 1.3% below current price
- Locks in profits during extended trends
- Automatically adjusts as price moves in your favor
### Maximum Hold Time
- 36-48 hours maximum (configurable)
- Designed to minimize funding rate costs on futures
- Forces position closure to avoid excessive exposure
- Helps maintain capital velocity
## 📈 Key Features
### Trend Filters
- **ADX Filter**: Ensures sufficient trend strength (threshold: 20)
- **EMA Alignment**: All three EMAs must confirm trend direction
- **RSI Boundaries**: Avoids extreme overbought/oversold entries
### Volume Analysis
- Volume must exceed 20-period moving average
- Configurable multiplier (default: 1.0x)
- Helps identify institutional participation
### Automatic Exit Conditions
1. Take Profit target reached
2. Stop Loss triggered
3. Trailing stop activated
4. Trend reversal (EMA cross in opposite direction)
5. Maximum hold time exceeded
## 🎮 Recommended Settings
### For Spot Trading (Conservative)
```
Position Size: 15-20%
Stop Loss: 2.5%
Take Profit: 6.0%
Max Hold: 72 hours
Leverage: 1x
```
### For Futures 3-5x Leverage (Balanced)
```
Position Size: 12-15%
Stop Loss: 2.0%
Take Profit: 5.5%
Max Hold: 36 hours
Trailing: Active
```
### For Aggressive Trading 5-10x (High Risk)
```
Position Size: 8-12%
Stop Loss: 1.5%
Take Profit: 4.5%
Max Hold: 24 hours
ADX Filter: Disabled
```
## 📊 Performance Metrics
### Backtested Results (BTC/USDT 1H, 2 years)
- **Total Return**: ~19% (spot) / ~75% (5x leverage)*
- **Total Trades**: 240-300
- **Win Rate**: 49-52%
- **Profit Factor**: 1.25-1.50
- **Max Drawdown**: ~18-22%
- **Average Trade**: 0.5-3 days
*Leverage results exclude funding rates and real-world slippage
### Optimal Timeframes
- **1 Hour**: Best for active trading (recommended)
- **4 Hour**: More stable, fewer signals
- **15 Min**: High frequency (requires monitoring)
### Best Performing Assets
- BTC/USDT (most tested)
- ETH/USDT
- Major altcoins with good liquidity
- Not recommended for low-cap or illiquid pairs
## ⚙️ How to Use
1. **Add to Chart**: Apply strategy to 1H BTC/USDT chart
2. **Adjust Settings**: Configure risk parameters based on your preference
3. **Review Signals**: Green = Long, Red = Short, labels show signal count
4. **Monitor Performance**: Check strategy tester for detailed statistics
5. **Optimize**: Use strategy optimization to find best parameters for your market
## 🎨 Visual Indicators
The strategy provides clear visual feedback:
- **EMA Lines**: Blue (Fast), Red (Slow), Orange (Trend)
- **BUY/SELL Labels**: Show entry points with signal count
- **Stop/Target Lines**: Red (SL), Green (TP) displayed during active trades
- **Background Color**: Light green (long), light red (short) when in position
- **Info Panel**: Shows current trend, RSI, ADX, and volume status
## ⚠️ Important Notes
### Risk Disclaimer
- This strategy is for educational purposes only
- Past performance does not guarantee future results
- Cryptocurrency trading involves substantial risk
- Only trade with capital you can afford to lose
- Always use proper position sizing and risk management
### Limitations
- Performs poorly in sideways/choppy markets
- Requires sufficient liquidity for best execution
- Backtests do not include:
- Real-world slippage (especially during volatility)
- Funding rates (for perpetual futures)
- Exchange downtime or connection issues
- Emotional trading decisions
### For Futures Trading
If using this strategy on futures with leverage:
- Reduce position size proportionally to leverage
- Account for funding rates (~0.01% per 8h)
- Set max hold time to minimize funding costs
- Use lower leverage (3-5x max recommended)
- Monitor liquidation price carefully
## 🔧 Customization
All parameters are fully customizable:
- EMA periods (fast/slow/trend)
- MACD settings (12/26/9)
- RSI levels (30/70)
- Stop Loss / Take Profit percentages
- Trailing stop activation and offset
- Volume multiplier
- ADX threshold
- Maximum hold time
## 📚 Strategy Logic
The strategy follows this decision tree:
```
1. Check Trend Direction (EMA alignment)
↓
2. Scan for Entry Signals (8 types)
↓
3. Confirm with Filters (ADX, Volume, RSI)
↓
4. Enter Position with Fixed SL/TP
↓
5. Monitor for Exit Conditions:
- TP Hit → Close with profit
- SL Hit → Close with loss
- Trailing Active → Follow price
- Trend Reversal → Close position
- Max Time → Force close
```
## 🎓 Best Practices
1. **Start Conservative**: Use smaller position sizes initially
2. **Track Performance**: Monitor actual vs backtested results
3. **Optimize Regularly**: Market conditions change, adapt parameters
4. **Combine with Analysis**: Don't rely solely on automated signals
5. **Manage Emotions**: Stick to the system, avoid manual overrides
6. **Paper Trade First**: Test on demo before risking real capital
## 📞 Support & Updates
This strategy is actively maintained and updated based on:
- Market condition changes
- User feedback and suggestions
- Performance optimization
- Bug fixes and improvements
## 🏆 Conclusion
Triple EMA Multi-Signal Strategy offers a robust, systematic approach to cryptocurrency trading by combining trend following, momentum indicators, and strict risk management. Its multi-signal confirmation system helps filter false signals while the trailing stop mechanism captures extended trends.
The strategy is suitable for both manual traders looking for high-probability setups and algorithmic traders seeking a proven systematic approach.
**Remember**: No strategy wins 100% of the time. Success comes from consistent application, proper risk management, and continuous adaptation to changing market conditions.
---
*Version: 1.0*
*Last Updated: November 2025*
*Tested on: BTC/USDT, ETH/USDT (1H, 4H timeframes)*
*Recommended Capital: $5,000+ for optimal position sizing*

Kalman Trend Sniper# KALMAN TREND SNIPER
## ORIGINALITY STATEMENT
The Kalman Trend Sniper combines adaptive trend detection with precision entry validation to identify high-probability trading opportunities. Unlike static moving averages that use fixed parameters, this indicator adapts to changing market volatility through ATR-based gain adjustment and distinguishes trending from ranging markets using ADX regime detection.
The indicator's unique contribution is its three-phase entry validation system: signals must hold for three bars, undergo a pullback test to the signal level, and receive confirmation through price action before generating an entry. This structured approach helps traders enter established trends at favorable retracement levels rather than chasing momentum.
---
## TECHNICAL METHODOLOGY
### Kalman Filter Implementation
This indicator implements an Alpha-Beta variant of the Kalman filter, a recursive algorithm that estimates trend from noisy price data:
1. Prediction: kf = kf + velocity
2. Error calculation: error = price - kf
3. Correction: kf = kf + gain * error
4. Velocity update: velocity = velocity + (gain * error) / 2
The gain parameter determines filter responsiveness. Higher gain values track price more closely but increase noise sensitivity, while lower values provide smoother output but lag price changes.
### Adaptive Gain Mechanism
The indicator adjusts gain dynamically based on volatility:
Volatility Factor = Current ATR / Long-term ATR
Adaptive Gain = Base Gain * (0.7 + 0.6 * Volatility Factor)
This ATR ratio increases responsiveness during high-volatility periods and reduces sensitivity during consolidations, addressing the fixed-parameter limitation of traditional moving averages. The volatility factor is bounded between configurable minimum and maximum values to prevent extreme adjustments.
### Regime Detection
The indicator uses the Average Directional Index (ADX) to distinguish market conditions:
- Trending markets (ADX above threshold): Full gain applied, signals generated
- Ranging markets (ADX below threshold): Gain reduced 25%, fewer signals
This regime awareness helps reduce whipsaw signals during sideways consolidation periods.
### Signal Line Validation System
When the Kalman line changes direction in trending conditions, the indicator draws a horizontal signal line at the low (for long signals) or high (for short signals) of the signal candle. This line represents a potential support or resistance level.
The validation system then monitors three phases:
Phase 1 - Hold Period: Price must remain above (long) or below (short) the signal line for three consecutive bars. This requirement filters weak signals where price immediately violates the signal level.
Phase 2 - Test: After the hold period, the system waits for price to pull back and touch the signal line, with configurable tolerance for volatile instruments.
Phase 3 - Confirmation: Within eight bars of the test, a confirmation candle must close above (long) or below (short) the test candle's body, demonstrating renewed momentum. If confirmation does not occur within eight bars, the validation attempt expires.
Successful validation generates an R label at the entry point. This three-phase structure helps identify entries where trend direction and support/resistance validation align.
---
## USAGE INSTRUCTIONS
### Signal Interpretation
Triangle Signals:
- Upward triangle (teal): Kalman line turns bullish in trending market (ADX above threshold)
- Downward triangle (red): Kalman line turns bearish in trending market
Signal Lines (horizontal):
- Teal line: Potential long support level at signal candle low
- Red line: Potential short resistance level at signal candle high
- Gray line: First opposite-color candle after signal (initial reversal pressure)
R Labels (optional, disabled by default):
- Green R below price: Validation complete for long entry
- Red R above price: Validation complete for short entry
Stop Levels:
- Red dots: Long stop level (Kalman line minus ATR multiplier)
- Teal dots: Short stop level (Kalman line plus ATR multiplier)
### Dashboard Information
The dashboard displays real-time indicator state:
- Trend: Current Kalman direction (BULL/BEAR)
- Regime: Market classification (Trending when ADX exceeds threshold, Ranging otherwise)
- Gain: Current adaptive gain value
- Vol Factor: Volatility ratio (current ATR / long-term ATR)
- ADX: Trend strength (higher values indicate stronger trends)
- Z-Score: Standard deviation distance from Kalman line (when enabled)
- Stop Dist: Current ATR-based stop distance
- Lines: Number of active signal lines displayed
- R-Status: Validation system state (Idle / Waiting / Testing)
### Trading Applications
Trend Following Approach:
1. Wait for triangle signal in trending market (ADX above threshold)
2. Enter immediately at signal candle close or wait for pullback
3. Place stop at displayed stop level
4. Trail stop using Kalman line as dynamic support/resistance
Validation Entry Approach (conservative):
1. After triangle signal, observe three-bar hold period
2. Wait for pullback to signal line (test phase)
3. Enter on R label confirmation
4. Place stop below/above signal line
5. Provides higher probability entries but reduces trade frequency
Z-Score Mean Reversion (when enabled):
1. Watch for Z-Score exceeding entry threshold (default +/-2.0)
2. Consider counter-trend entries when price touches Kalman line
3. Target return to Kalman line (Z-Score near zero)
4. Use Z-Score threshold as stop level for extreme continuation
### Optimal Conditions
The indicator performs optimally in clearly trending markets where ADX consistently exceeds the threshold. Performance degrades in sideways, choppy conditions.
Recommended timeframes:
- 1-5 minute charts: Use Crypto_1M preset (faster adaptation)
- 15-60 minute charts: Use Crypto_15M preset (balanced)
- Hourly charts: Use Forex preset (smoother)
- Daily charts: Use Stocks_Daily preset (long-term trends)
Market conditions:
- High volatility (Vol Factor above 1.5): Expect faster adaptation, wider stops needed
- Normal volatility (Vol Factor 0.7-1.5): Standard behavior
- Low volatility (Vol Factor below 0.7): Expect slower adaptation, tighter stops possible
---
## PARAMETER DOCUMENTATION
### Kalman Filter Settings
Preset Mode: Select optimized configuration for specific markets
- Custom: Manual parameter control
- Crypto_1M: Base Gain 0.05, ATR 7 (fast response for 1-5 minute crypto charts)
- Crypto_15M: Base Gain 0.03, ATR 14 (balanced for 15-60 minute crypto charts)
- Forex: Base Gain 0.02, ATR 14 (standard for forex pairs)
- Stocks_Daily: Base Gain 0.01, ATR 20 (smooth for daily stock charts)
Base Gain (0.001-0.2): Core Kalman filter responsiveness parameter. Higher values increase sensitivity to price changes. Low values (0.01-0.02) provide smooth output with fewer whipsaws but slower trend changes. High values (0.06-0.08) offer fast response with more signals but increased whipsaw risk.
Adaptive (checkbox): When enabled, automatically adjusts gain based on ATR ratio. Recommended to keep enabled for dynamic volatility adaptation.
ATR (5-50): Short-term Average True Range period for current volatility measurement. Default 14 is industry standard. Lower values respond faster to volatility changes.
Long ATR (20-200): Long-term ATR period for baseline volatility comparison. Default 50 provides stable reference. The ratio between ATR and Long ATR determines adaptive adjustment magnitude.
Regime Filter (checkbox): Enables ADX-based trending/ranging detection. When enabled, reduces gain by 25 percent during ranging markets to minimize false signals.
ADX Period (7-30): Period for ADX calculation. Default 14 is standard. Lower values respond faster to trend strength changes.
Threshold (15-40): ADX level distinguishing trending from ranging markets. Default 25. Above threshold: trending (generate signals normally). Below threshold: ranging (reduce sensitivity).
Min Vol / Max Vol (0.3-3.0): Bounds for volatility factor adjustment. Prevents extreme gain changes during unusual volatility spikes or quiet periods. Default minimum 0.5, maximum 2.0.
Stop ATR x (1.0-3.0): Multiplier for ATR-based stop loss distance. Default 2.0 places stops two ATRs from Kalman line. Use 1.5 for tight stops (intraday), 2.5-3.0 for wide stops (swing trading).
Show Signals (checkbox): Displays triangle signals when Kalman changes direction in trending markets. Disable to use indicator purely as dynamic support/resistance without signals.
Z-Score (checkbox): Enables mean-reversion signal generation based on statistical deviation from Kalman line.
Period (10-100): Lookback period for Z-Score standard deviation calculation. Default 20 bars. Longer periods produce smoother, less sensitive readings.
Entry (1.5-3.5): Standard deviation threshold for Z-Score signals. Default 2.0 generates signals at plus/minus two standard deviations (approximately 95th percentile moves).
Bull / Bear Colors: Customize Kalman line colors for uptrend (default teal) and downtrend (default red).
Fill (checkbox): Shows semi-transparent fill between price and Kalman line for visual trend emphasis.
### Signal Line System Settings
Signal Lines (checkbox): Displays horizontal signal lines at low (long) or high (short) of signal candles. These function as dynamic support/resistance levels.
Reverse Lines (checkbox): Shows gray horizontal lines at first opposite-colored candle after signal. Helps identify initial resistance points in new trends.
Max Lines (0-20): Maximum number of signal lines to display simultaneously. Older lines are removed as new signals appear. Use 1-2 for clean charts, 3-5 for recent support/resistance history.
Style (Solid/Dotted/Dashed): Visual style for signal and reverse lines. Dotted provides subtle appearance, solid is most prominent.
Line % / Label % (0-100): Transparency percentage for lines and labels. Zero is fully opaque, 100 is invisible.
R Labels (checkbox): Shows R labels when validation confirmation occurs. Default disabled. Enable if you want visual confirmation of successful pullback entries.
Tolerance % (0-1.0): Price deviation tolerance for test candle detection. Zero requires exact touch. 0.5 allows 0.5 percent deviation for volatile instruments.
### Dashboard Settings
Show Dashboard (checkbox): Toggles visibility of information panel. Disable for clean chart presentation.
Position: Choose dashboard location from nine positions (Top/Middle/Bottom combined with Left/Center/Right).
---
## LIMITATIONS AND WARNINGS
This indicator is a technical analysis tool that processes historical price data. It does not predict future price movements.
Inherent limitations:
1. Lagging nature: Like all trend indicators, the Kalman filter lags price. Signals occur after trend changes begin, not before.
2. Ranging markets: Generates fewer signals and reduced performance when ADX falls below threshold. Not optimized for sideways consolidation.
3. Whipsaw risk: In choppy, indecisive markets near ADX threshold, signals may reverse quickly despite regime filtering.
4. Parameter sensitivity: Inappropriate Base Gain settings can cause over-trading (too high) or missed trends (too low).
5. Validation requirement: The three-phase confirmation system provides higher accuracy but significantly reduces trade frequency. Not all trends produce valid pullback entries.
Not suitable for:
- Scalping strategies requiring instant signals (Kalman filter has intentional smoothing)
- Ultra-high frequency trading (indicator updates once per bar close)
- Markets with extreme overnight gaps (stops may be exceeded)
- Strategies requiring signals on Heikin Ashi, Renko, Kagi, Point and Figure, or Range charts
Risk management requirements:
This indicator provides trend direction and signal levels but does not incorporate position sizing, risk management, or account balance considerations. Users must implement appropriate position sizing, maximum daily loss limits, and portfolio diversification. Past performance does not indicate future results.
Optimal usage:
- Works optimally in clearly trending markets where ADX consistently exceeds threshold
- Performance degrades in sideways, choppy conditions
- Designed for swing trading and position trading timeframes (15-minute and above)
- Requires confirmation from price action or additional technical analysis
---
## NO REPAINT GUARANTEE
This indicator operates on bar close confirmation only. All signals, signal lines, and validation labels appear exclusively when candles close. Historical signals remain exactly where they appeared. This makes the indicator suitable for automated trading and reliable backtesting. What you see in historical data matches what appeared in real-time.
---
## ALERTS
The indicator provides eight alert conditions:
1. Kalman Buy Signal: Fires when upward triangle appears (bullish trend change in trending market)
2. Kalman Sell Signal: Fires when downward triangle appears (bearish trend change in trending market)
3. Trend Change to Bullish: Fires whenever Kalman line changes to bullish (regardless of ADX)
4. Trend Change to Bearish: Fires whenever Kalman line changes to bearish (regardless of ADX)
5. SCT-R Long Retest Confirmed: Fires when green R label appears for long validation
6. SCT-R Short Retest Confirmed: Fires when red R label appears for short validation
7. SCT Test Long Detected: Fires when test candle appears for long signal (before confirmation)
8. SCT Test Short Detected: Fires when test candle appears for short signal (before confirmation)
Alert messages include context about bar close confirmation and current price levels.
---
## CALCULATION TRANSPARENCY
While complete proprietary optimization methodology is not disclosed, the core technical approach is fully explained: Alpha-Beta Kalman filter with ATR-based adaptive gain adjustment and ADX regime detection. The signal line validation system uses a three-phase structure (hold, test, confirmation) with configurable parameters. Users can understand indicator functionality and make informed decisions about application.
---
## DISCLAIMER
This indicator is provided as a technical analysis tool. It does not constitute financial advice, trading recommendations, or performance guarantees. All trading decisions carry risk. Users are responsible for their own trading decisions and risk management. Past results do not indicate future performance.

Average Directional Index infoAverage Directional Index (ADX) is a technical indicator created by J. Welles Wilder that measures trend strength (not direction!). Values range from 0 to 100.
This indicator is a supplementary tool for assessing whether trend strategies are worthwhile, monitoring changes in trend strength and avoiding weak, choppy movements
Value Interpretation:
0-25: Weak trend or sideways market
25-50: Moderate to strong trend
50-75: Very strong trend
75-100: Extremely strong trend (rare)
Important: ADX does not indicate trend direction (up/down), only its strength!
This script indicator includes additional features:
1. ADX Plot (purple line)
Basic ADX value showing current trend strength.
2. ADX Trend Analysis (arrows)
The script compares current ADX with its 10-period moving average with ±5% tolerance:
↑ (green): ADX rising → trend strengthening
↓ (red): ADX falling → trend weakening
⮆ (gray): ADX stable → trend strength unchanged
3. Information Table
Displays current ADX value with trend arrow in the top-right corner.
Parameters to Configure
Smoothing (default: 14) - Indicator smoothing period
Lower values (e.g., 7): more sensitive, more signals
Higher values (e.g., 21): more stable, less noise
Indicator Length (default: 14) - Period for calculating directional movement (+DI/-DI)
Wilder's standard value is 14
Trend Length (default: 10) - Period for moving average to analyze ADX dynamics
Determines how quickly changes in trend strength are detected
Practical Application
✅ Strategy 1: Trend Strength Filter
1. ADX > 25 → look for positions aligned with the trend
2. ADX < 25 → avoid trend strategies, consider oscillators
✅ Strategy 2: Entries on Strengthening Trend
1. ADX crosses above 25 + arrow ↑ → trend gaining momentum
2. Combine with other indicators (e.g., EMA) for direction confirmation
✅ Strategy 3: Exhaustion Warning
1. ADX > 50 + arrow ↓ → strong trend may be exhausting
2. Consider profit protection or trailing stop

TCP DMITCP DMI - Advanced Technical Indicator
This advanced DMI (Directional Movement Index) indicator enhances the traditional DMI by adding intelligent dynamic support and resistance levels based on historical price action analysis.
KEY FEATURES:
1. Standard DMI Components:
- DI+ (Directional Indicator Positive): Measures upward price movement
- DI- (Directional Indicator Negative): Measures downward price movement
- ADX (Average Directional Index): Measures trend strength
- Middle line at 20 for reference
2. Dynamic Support & Resistance Levels:
The indicator automatically identifies the most significant support and resistance levels by analyzing the last 400 candles (customizable) and detecting where DI lines have been rejected most frequently.
TWO TIERS OF LEVELS:
A) Normal Levels (Solid Lines):
- Support: Below 15
- Resistance: Above 25
- Style: Solid lines with 60% transparency
- These represent moderate support/resistance zones
B) Strong Levels (Dashed Lines):
- Strong Support: Below 10
- Strong Resistance: Above 30
- Style: Dashed lines with 40% transparency (more visible)
- These represent critical support/resistance zones
3. Intelligent Display Logic:
- When DI is ABOVE 20: Shows resistance levels (where price might face selling pressure)
- When DI is BELOW 20: Shows support levels (where price might find buying support)
- Each DI line (+ and -) has its own color-coded support/resistance levels for easy identification
4. Color Coding:
- DI+ levels use GREEN (customizable)
- DI- levels use RED/ORANGE (customizable)
- Support/Resistance lines match their respective DI colors but with reduced opacity
- This makes it instantly clear which DI the support/resistance belongs to
5. Rejection Detection Algorithm:
The indicator scans historical data to find peaks and troughs at specific levels, counting how many times price was rejected at each level. The level with the most rejections becomes the displayed support or resistance.
CUSTOMIZABLE PARAMETERS:
- ADX Smoothing: Default 14
- DI Length: Default 14
- Lookback Period: 400 candles (range: 50-500)
- Line Length: 15 candles forward + 15 candles back = 30 candle span
- DI+ Color: Customizable (default green)
- DI- Color: Customizable (default red)
- ADX Color: Customizable (default blue)
- Normal S/R Transparency: Default 60%
- Strong S/R Transparency: Default 40%
HOW TO USE:
1. Trend Identification:
- When DI+ crosses above DI-: Potential uptrend
- When DI- crosses above DI+: Potential downtrend
- ADX above 25: Strong trend
- ADX below 20: Weak trend or ranging market
2. Support/Resistance Trading:
- Watch for price reaction when DI approaches displayed support/resistance levels
- Solid lines = moderate levels
- Dashed lines = strong levels (more significant)
- The more rejections at a level, the more significant it becomes
3. Entry/Exit Signals:
- Entry: When DI bounces off support (below 20) or resistance (above 20)
- Exit: When DI breaks through major support/resistance levels
- Strong levels (dashed) are more reliable for major decisions
ADVANTAGES:
✓ Reduces chart clutter by only showing relevant levels based on current DI position
✓ Automatically adapts to changing market conditions
✓ Color-coded for instant visual recognition
✓ Two-tier system helps prioritize trading decisions
✓ Historical rejection analysis provides data-backed levels
✓ Fully customizable to match any trading style
BEST USED FOR:
- Swing trading
- Trend following
- Support/resistance trading strategies
- Identifying potential reversal zones
- Confirming breakout validity
- Risk management (stop-loss placement)
This indicator combines the power of traditional DMI with smart support/resistance detection, giving traders a comprehensive tool for technical analysis without overwhelming the chart with excessive information.

Clean CPR v2.0Clean CPR v2.0 – Multi-Timeframe CPR & Bias Dashboard
Author: @jsm
// modified from "CPR (Central Pivot Range)" script by ajithcpas and Simple CPR by finallynitin
1. Overview
Clean CPR v2.0 is an intraday + swing CPR toolkit designed to keep the chart visually clean while still giving a full “context dashboard” on the right side.
The script combines:
Classic / Fibonacci / Camarilla CPR with multi-timeframe options
Previous-session CPR & zones
Developing CPR + Dev R1 / Dev S1
Initial Balance & custom session ranges
A sentiment dashboard (Monthly / Weekly / Daily CPR)
CPR width & CPR-type classification with emojis
A >21-EMA “status pill”
Optional Moving Averages and a Day-Open Anchored VWAP
2. Main CPR Engine
What it plots (depending on your inputs):
Central Pivot Range (CPR): BC, TC, PP
Pivot SR levels (R1–R5 / S1–S5)
Choice of Traditional, Fibonacci, Classic, Camarilla formulas
Ability to hide CPR-based SR (for a very clean look)
Multi-timeframe CPR source (Daily, Weekly, Monthly, Quarterly, Half-yearly, Yearly, or Auto)
Extras:
Historical SR pivots (optional)
Adjustable number of CPRs to look back
Label side (Left / Right) and line width controls
3. Previous Session Structure
Optional plotting of the previous session’s structure:
Previous High / Previous Low
Previous CPR (PH / PL zones)
Shaded zones between: PH ↔ R1, PL ↔ S1
Clean labels with prices on the right, aligned to the current day
This gives a quick view of “yesterday’s battle zone” relative to today’s price.
4. Developing CPR & Dev R1 / Dev S1
For intraday traders, the script includes a Developing CPR module:
Dev CPR band for the current session
Optional Dev R1 and Dev S1 levels
Implementation details:
Only the latest Dev CPR / Dev R1 / Dev S1 labels are kept on screen – old labels are cleaned up so you don’t get a vertical stack as time moves.
Option to extend developing CPR lines further into the session.
5. Initial Balance (IB) & Custom Ranges
The script can show:
Initial Balance high/low (first X minutes)
IB extension lines and range
Additional user-defined custom session windows
This is useful for breakout / range traders around the opening range.
6. >21 EMA Status Box
On the right side you can enable a compact >21EMA info box:
Uses Daily 21 EMA (requested via security() so it’s consistent across intraday timeframes).
A dot + label show the relationship between close and 21 EMA:
7. Dashboard – Monthly / Weekly / Daily CPR Context
A compact dashboard table appears on the right (position & size configurable).
7.1 Location vs CPR (M / W / D)
For each timeframe:
It classifies the close as Above / Inside / Below its CPR band.
7.2 Sentiment Header – “Trust the Bulls / Bears / Patience”
The dashboard header follows Daily CPR location:
If Daily is above its CPR → header: “Trust the Bulls” (green background)
If Daily is below its CPR → header: “Trust the Bears” (red background)
If Daily is inside its CPR → header: “Have Patience” (neutral grey)
8. CPR Width & CPR Type (with Emojis)
8.1 CPR Width – Daily
Daily CPR width (% of price) is classified as:
🎯 Super Narrow
📏 Narrow
➖ Medium
📐 Wide
Useful for identifying potential trend / expansion days vs balanced sessions.
8.2 CPR Type – 3-day Structure
Based on the last three daily CPRs, the script categorises CPR structure as:
Ascending – 3-day rising CPR
Descending – 3-day falling CPR
Inside – today’s CPR within yesterday’s
Outside – today’s CPR outside yesterday’s
Asc Rev – bullish reversal pattern
Desc Rev – bearish reversal pattern
Overlapping – messy / overlapping CPRs
9. Moving Averages (MA 1–5)
Optional Moving Average panel Up to 5 MAs, each configurable:
Type: SMA, EMA, SMMA (RMA), WMA, VWMA
10. Day-Open Anchored VWAP
Optional Day-Open VWAP module. Resets VWAP at each new trading day’s open.
This is helpful for intraday mean-reversion and VWAP-based trade locations.
11. Recommended Use & Notes
Best used on indices and liquid futures where CPR, previous session zones and VWAP have strong interaction.
Works on any timeframe; for the full effect, try intraday charts (3-15 min) with:
Dashboard enabled
Daily CPR as the base
Dev CPR + Day-Open VWAP for intraday structure
21EMA box and one or two MAs for trend confirmation.
Disclaimer:
This script is for educational and informational purposes only. It does not constitute financial advice or a recommendation to buy or sell any security. Always test on paper / demo and combine with your own analysis and risk management.

ADX Trend Strength Filter + TRAMA [DotGain]Summary
Are you tired of trading trend signals, only to get stopped out in volatile, sideways chop?
The ADX Trend Strength Filter (ADX TSF) is designed to solve this exact problem. It is a comprehensive trend-following system that only generates signals when a trend not only has the right direction and momentum, but also sufficient strength.
This indicator filters out weak or indecisive market phases (the "chop") and will only color the bars Green or Red when all conditions for a strong, confirmed trend are met.
⚙️ Core Components and Logic
The ADX TSF relies on a triple-filter logic to generate a clear trade signal:
Trend Filter (TRAMA): A TRAMA (Trending Adaptive Moving Average) is used as the main trendline. This adaptive average automatically adjusts to market volatility, acting as a dynamic support/resistance level.
Price > TRAMA = Bullish
Price < TRAMA = Bearish
Momentum Filter (RSI Crossover): Momentum is measured by a crossover of two moving averages of the RSI (a fast EMA and a slow SMA). This confirms whether the momentum is pointing in the same direction as the trend.
Strength Filter (ADX): This is the most important filter. A signal is only considered valid if the ADX (Average Directional Index) is above a defined threshold (Default: 30). This ensures the trend has sufficient strength.
🚦 How to Read the Indicator
The indicator has three states, displayed directly as bar colors on your chart:
🟩 GREEN BARS (Strong Uptrend) All three conditions are met:
Price is above the TRAMA.
RSI momentum is bullish (Fast MA > Slow MA).
ADX is above 30 (Strong trend is present).
🟥 RED BARS (Strong Downtrend) All three conditions are met:
Price is below the TRAMA.
RSI momentum is bearish (Fast MA < Slow MA).
ADX is above 30 (Strong trend is present).
🟧 ORANGE BARS (Neutral / Caution) This state appears if any of the following conditions are true:
Weak Trend: The ADX is below 30. The market is in consolidation or a sideways phase. (This is the primary filter!)
Indecision: The price is caught in the "Neutral Zone" between the TRAMA and the 200 SMA.
Visual Elements
Bar Colors: (Green/Red/Orange) Show the current trend status.
TRAMA (Orange Line): Your primary adaptive trendline.
200 SMA (White Line): Serves as a reference for the long-term trend.
Orange Background (Fill): Fills the area between the TRAMA and SMA to visually highlight the "Neutral Zone."
Key Benefit
The goal of the ADX TSF is to keep traders out of weak, unpredictable markets and help them participate only in strong, momentum-confirmed trends.
Have fun :)
Disclaimer
This "Buy The F*cking Dip" (BTFD) indicator is provided for informational and educational purposes only. It does not, and should not be construed as, financial, investment, or trading advice.
The signals generated by this tool (both "Buy" and "Sell") are the result of a specific set of algorithmic conditions. They are not a direct recommendation to buy or sell any asset. All trading and investing in financial markets involves substantial risk of loss. You can lose all of your invested capital.
Past performance is not indicative of future results. The signals generated may produce false or losing trades. The creator (© DotGain) assumes no liability for any financial losses or damages you may incur as a result of using this indicator.
You are solely responsible for your own trading and investment decisions. Always conduct your own research (DYOR) and consider your personal risk tolerance before making any trades.

TraderMathLibrary "TraderMath"
A collection of essential trading utilities and mathematical functions used for technical analysis,
including DEMA, Fisher Transform, directional movement, and ADX calculations.
dema(source, length)
Calculates the value of the Double Exponential Moving Average (DEMA).
Parameters:
source (float) : (series int/float) Series of values to process.
length (simple int) : (simple int) Length for the smoothing parameter calculation.
Returns: (float) The double exponentially weighted moving average of the `source`.
roundVal(val)
Constrains a value to the range .
Parameters:
val (float) : (float) Value to constrain.
Returns: (float) Value limited to the range .
fisherTransform(length)
Computes the Fisher Transform oscillator, enhancing turning point sensitivity.
Parameters:
length (int) : (int) Lookback length used to normalize price within the high-low range.
Returns: (float) Fisher Transform value.
dirmov(len)
Calculates the Plus and Minus Directional Movement components (DI+ and DI−).
Parameters:
len (simple int) : (int) Lookback length for directional movement.
Returns: (float ) Array containing .
adx(dilen, adxlen)
Computes the Average Directional Index (ADX) based on DI+ and DI−.
Parameters:
dilen (simple int) : (int) Lookback length for directional movement calculation.
adxlen (simple int) : (int) Smoothing length for ADX computation.
Returns: (float) Average Directional Index value (0–100).

ADX Trend Color HistogramOverview:
This script provides a visually enhanced version of the classic Average Directional Index (ADX) indicator. Instead of a simple line, it plots the ADX as a histogram, making it easier to gauge trend strength at a glance. The key feature is its dynamic color-coding, which shifts based on the relationship between the Directional Indicators (DI+ and DI-), offering immediate insight into market momentum.
Features:
Histogram Style: The ADX value is presented as a histogram for clear, easy-to-read visualization of trend strength.
Dynamic Color-Coding: The histogram bars are colored green when DI+ is greater than DI-, indicating bullish momentum. They turn red when DI- is greater than DI+, signaling bearish momentum.
Customizable Transparency: The default color transparency is set to 80% (20% opacity) for a clean look that doesn't overpower the main chart, but this can be adjusted in the script's color settings.
Built-in Alerts: The script includes configurable alerts that trigger whenever the momentum shifts, i.e., when the color of the histogram changes from red to green or vice-versa. This allows you to stay notified of potential changes in trend direction without constantly watching the chart.
Clean and Simple: The code is well-structured and commented for clarity, making it easy for other PineScripters to understand or modify.
How to Use:
Assess Trend Strength: The height of the histogram bars represents the strength of the current trend. Higher bars suggest a stronger trend (either bullish or bearish), while lower bars indicate a weak or non-trending market.
Identify Momentum Direction: The color of the bars provides a quick guide to the direction of market momentum.
Green Bars: Indicate that the upward momentum is dominant.
Red Bars: Indicate that the downward momentum is dominant.
Use Alerts for Signals: Set up alerts in TradingView based on the "ADX Green" and "ADX Red" conditions to receive notifications for potential entry or exit signals when the momentum shifts. A change from red to green can signal a potential bullish reversal or continuation, while a change from green to red can signal a bearish one.

Range Opening (ADX)▶ OVERVIEW
Range Opening (ADX) dynamically detects market opening ranges triggered by ADX (Average Directional Index) momentum shifts. Upon a user-defined ADX crossover or crossunder event, it builds a volume-based range box that tracks high and low prices over a fixed bar length and visualizes order flow pressure with delta volume and breakout buffer zones.
▶ RANGE TRIGGER VIA ADX CROSSOVER
The range begins when ADX crosses a custom threshold, indicating a shift in trend strength:
Users choose between ADX crossover or crossunder as the trigger.
Once triggered, the indicator starts collecting price and volume data for the specified “Range Opening Length.”
The ADX plot on the subchart is colored dynamically using a green-to-magenta gradient based on its strength.
A small label marks the ADX crossover/crossunder event visually.
▶ RANGE DEVELOPMENT BOX
While the range is forming:
Price highs and lows over the defined period are collected and stored.
A temporary gray box is drawn between the maximum high and minimum low, showing the developing range.
At each bar, delta volume is updated:
Positive if close > open
Negative if close < open
A total delta volume value is shown inside the developing box for real-time monitoring.
▶ RANGE COMPLETION & BREAKOUT LINES
Once the range completes (after the defined bar count):
The gray box is replaced with a finalized, color-coded range box.
Color Logic:
Green box if delta volume is positive (bullish bias)
Magenta box if delta is negative (bearish bias)
Two solid horizontal lines are drawn:
Top line from the range high
Bottom line from the range low
Two dashed lines are added above and below the range using ATR-based buffers, acting as buffer zones.
These lines extend until a new ADX trigger occurs, helping track future price interaction with the range.
▶ INFO PANEL & STATUS MONITORING
A compact data table appears in the top-right corner, offering quick insight:
ADX: Current value, color-coded to strength.
Threshold: User-defined trigger level.
Range Status:
Shows a green diamond when range is still forming.
Shows a magenta diamond after the range has completed.
Tooltip updates to “Developing” or “Formatted” based on stage.
▶ USAGE
Traders can use Range Opening (ADX) to:
Identify periods of strength expansion and price consolidation using ADX signals.
Track breakout potential and liquidity zones formed during opening-type setups.
Monitor delta volume to gauge buying/selling bias inside short-term ranges.
Use ATR buffer zones for breakout confirmation or fade setups.
Visually mark where the most recent structured range was defined.
▶ CONCLUSION
Range Opening (ADX) offers a systematic method to detect and monitor market ranges triggered by volatility surges. With real-time delta volume insight, persistent breakout levels, and ADX-driven logic, it serves as a versatile tool for both breakout traders and range strategists looking to capitalize on momentum-based setups.

AI Bot Regime Feed (v6) — stableThis indicator generates real-time, structured JSON alerts for external trading bots or automation systems.
It combines multiple technical layers to identify market regimes and high-probability buy/sell events, and sends them to any webhook endpoint (e.g., a FastAPI or Zapier listener).

Vol-Pace Projected-ATR-ADX-Alert-MAThe VolSC indicator analyzes stock volume trends with a focus on the Pace metric, which projects today's volume as a percentage of the 30-day average, highlighting unusual activity (e.g., over 200% turns bright green with alerts). The phantom projection bar, a wide green histogram to the right of the last bar, visually represents this projected volume on daily charts only, aiding quick identification of potential volume surges without cluttering intraday or weekly views. Additional features include ADX strength, ATR averages, and customizable table display for comprehensive insights.
Key Features:
* Primary Indicator: Volume with ADX (Average Directional Index) text.
* Pacing and Alerts: Calculates the volume pace for the day. Features an unusual volume alert with an adjustable threshold (e.g., 200%).
* Volume Projection: Projects a visual "Phantom Volume" for the day, offset to the right of the actual volume bar.
* ATR Indicator: Displays the 2x ATR (Average True Range) value as text.
* Volume Average: Displays the ADV (Average Daily Volume) Moving Average as text.
* Customization: Most settings are adjustable.

Atlantean Sideways / Range Regime DetectorPurpose
When using trend based indicators, you can skip the false signals when there is a sideways action, protecting you from the false signals.
Flags likely sideways/range phases using three checks:
Weak trend (ADX from DMI)
Price compression (Bollinger Band Width, normalized)
Low volatility (NATR = ATR/Price%)
Logic
isSideways = (ADX < adxThresh) AND (bbNorm < 0.25) AND (NATR < natrMax)
When true: bars + background turn teal and a provisional Range High/Low (rolling rangeWin) is drawn.
Key Inputs
DMI: diLen(22)
Optimized for 15 mins Bitcoin, could change it to 14 for more general approach
ADX: adxSmooth(14), adxThresh(18)
Volatility: lenATR(14), natrMax(1.8)
Visuals: rangeWin(20), bar/range toggles
Quick Tuning
More signals: raise adxThresh to 20–25, raise natrMax to 2.5–4.0, increase BB cutoff by editing bbNorm < 0.25 --> 0.35–0.50.
Smoother range lines: increase rangeWin to 30–40.
Use Cases
Mean reversion inside teal ranges.
Breakout prep when price closes outside the drawn range after teal ends. Could be used as a signal although not suggested.
Filter trend systems: skip trades when sidewaysCond is true. This is the main purpose, for it to be combined with trend based indicators, like Supertrend.
Alert
“Sideways Detected” triggers when isSideways is true.
Script could be expanded upon your requests.

OBV Cloud v1.0 [PriceBlance]🌐 English
OBV Cloud v1.0 – Free & Open-Source
OBV Cloud v1.0 integrates On-Balance Volume (OBV) with a Cloud model and enhanced trend filters.
It helps traders quickly identify:
Money Flow Trend: OBV Cloud acts as a dynamic support/resistance zone.
Trend Filters: EMA9 (short-term) and WMA45 (medium-term) directly applied on OBV.
OBV–Price Divergence: Detects both regular and hidden bullish/bearish divergences.
Trend Strength: Measured with ADX calculated on OBV.
OBV Cloud is suitable for both swing and day trading, allowing traders to spot breakouts, reversals, or sustained trends through volume-based analysis.

DMI Toolbox StrategyThe Directional Movement Index (DMI) was originally developed by J. Welles Wilder Jr. in 1978. Wilder introduced the DMI along with the Average Directional Index (ADX) in his book, “New Concepts in Technical Trading Systems,” which became a foundational reference for technical analysis.
The indicator can offer a myriad of signals for building a trading strategy. In an effort to provide the user with a meaningful way to evaluate these signals, this DMI Toolbox Strategy offers the chance to back-test various combinations and permutations of DMI signals on long trades. By default it will open a long position on the +DI (upward movement) crossing above the -DI (downward movement). By default, It exits long positions when the ADX (trend strength) reverses.
Suggested Use
Try a wide variety of long entry and exit signals across many different timeframes to see what is most effective for the item you wish to trade. There is a table in the upper right corner that will give a quick view of which signal is dominant across 5 timeframes, based on your current settings. Adjust the pyramidding, slippage, and commission values to more closely match your situation.
Visual Helpers
The DMI indicator has been altered to include a smoothed version of the ADX, as well as a colored background to show which signal is dominant (+DI or -DI). Small up arrows call your attention to ADX crossovers that may indicate a significant threshold in trend strength.

Sentinel Nexus Dashboard [AGP] Ver.1.5Sentinel Nexus Dashboard is a versatile Pine Script designed as a comprehensive technical analysis tool. It condenses a variety of key indicators and metrics into a single, intuitive visual dashboard, providing an integrated view of market trends, momentum, volatility, and liquidity, all neatly organized on your TradingView chart.
Key Features and Benefits
All-in-One Dashboard: This script centralizes relevant information, offering a clean, efficient control panel that helps you make quick decisions without cluttering your chart with multiple overlays.
Trend Analysis with ADX: It incorporates the Average Directional Index (ADX) to measure trend strength. The dashboard displays ADX, DI+, and DI- values with dynamic color-coding to highlight trend intensity (e.g., blue for a very strong trend).
Momentum Analysis with MACD: The dashboard shows MACD line and signal line values in a table. The background color of the MACD values reflects the histogram's direction, allowing you to quickly identify crosses and shifts in market momentum.
Multi-Timeframe RSI Analysis: The RSI (Relative Strength Index) dashboard displays values across multiple timeframes (from 1 minute to 1 month). Overbought (77) and oversold (23) levels are color-coded for immediate identification of market conditions, making it an ideal tool for multi-timeframe analysis.
Smart and Dynamic Volume: The script uses a bar coloring algorithm based on average volume. Chart bars change color according to volume magnitude (extreme, high, average, or low) relative to the average, distinguishing between bullish and bearish bars. This helps you identify significant, liquidity-driven price movements.
Fair Value Analysis: The script calculates an asset's "fair value" using a noise filter (similar to a Kalman filter) on recent highs and lows to determine a midpoint. The price dashboard's background color changes to indicate if the current price is above or below this fair value.
Fibonacci EMA Analysis: A table displays several Exponential Moving Averages (EMAs) based on the Fibonacci sequence. The values are color-coded to show whether the current price is above (white) or below (orange) each EMA, helping you quickly identify dynamic support and resistance levels.
CME Futures Data Integration: For Bitcoin, the script can show a chart label with the Bitcoin futures price (CME:BTC1!), allowing you to compare the spot price with the CME futures market.
Potential Uses and Applications
The Sentinel Nexus Dashboard is an excellent support tool for trading. It is not a signal system but rather a suite of confirmation tools that can be used to:
Confirm Trend Strength: Before entering a trade, use the ADX data to ensure the trend has enough strength for your expected move.
Detect Reversal Points: Multi-timeframe RSI data can alert you to potential overbought or oversold conditions, indicating possible exhaustion of a price move.
Validate Price Movements: Bar coloring based on volume helps you determine if a price move is genuine and supported by strong market participation. High volume can confirm a breakout or reversal.
Identify Support and Resistance: The Fibonacci EMAs allow you to quickly visualize key levels where price might find support or resistance, aiding in planning entries and exits.
In short, this script is perfect for traders who want a comprehensive market overview without chart clutter. It efficiently integrates trend, momentum, and volume analysis in one place.
Legal Disclaimer
RISK WARNING:
This Pine Script is a technical analysis tool and should not be considered financial advice. Past performance of any indicator is no guarantee of future results. Trading in financial markets involves a high risk of loss and is not suitable for all investors. By using this indicator, you accept full responsibility for your trading decisions and acknowledge that any financial loss is your sole responsibility.
IMPORTANT:
Some script functions, such as the CME price label, may not work correctly if your TradingView subscription plan is not a paid one. Please check your plan's limitations to ensure the indicator's optimal functionality.

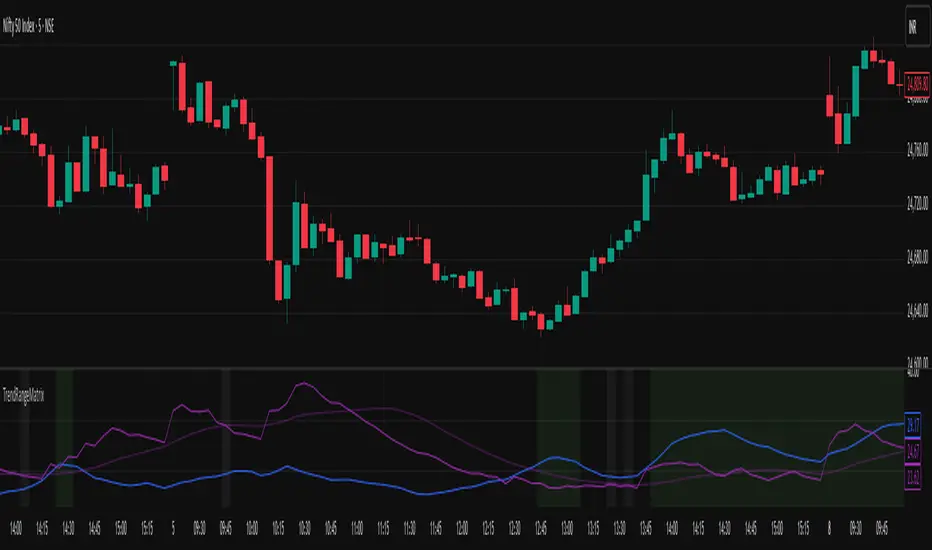
Nifty Trend vs Range (Final)This indicator is designed to help you quickly identify whether the Nifty market is trending, ranging, or preparing for a breakout by combining three volatility and trend-strength measures:
India VIX (Volatility Index)
ADX (Average Directional Index)
ATR (Average True Range)
It creates a Trend vs Range Decision Matrix that categorizes the market into actionable states such as Range – Quiet, Breakout Watch, Trend – Smooth, Trend – Confirmed, Trend – Volatile, or Choppy / Noisy.
🔑 How it Works
India VIX (Market Volatility)
Pulled directly from NSE:INDIAVIX (or your chosen symbol).
VIX thresholds are defined:
Below VIX Low → Calm market (often ranges).
Between VIX Low & High → Neutral/moderate volatility.
Above VIX High → High volatility (potential big moves or choppiness).
VIX can be scaled and plotted in the same pane with ADX/ATR, or shown separately with a companion script.
ADX (Trend Strength)
Custom calculation (Wilder’s smoothing, not built-in ta.adx), to ensure more consistent results.
Thresholds (auto-tuned by timeframe if enabled):
Low ADX → Weak/no trend, sideways.
High ADX → Strong directional trend.
ATR (Volatility Expansion)
ATR compared to a moving average of ATR detects whether volatility is rising or flat.
Used as confirmation for breakouts or fading moves.
🧠 Market State Logic
The script combines the three signals into an interpretable market state:
Range – Quiet → VIX low, ADX low, ATR flat
Trend – Smooth → VIX low, ADX high
Breakout Watch → VIX neutral, ADX low, ATR rising
Trend – Confirmed → VIX neutral, ADX high, ATR rising
Choppy / Noisy → VIX high, ADX low, ATR rising
Trend – Volatile → VIX high, ADX high, ATR rising
Neutral → fallback if conditions don’t match
Each state is color-coded with background shading and displayed as a persistent label with key metrics (VIX, ADX, ATR).
⚙️ Features
✅ Intraday Auto-Tuning
ADX/ATR thresholds automatically adjust depending on chart timeframe (5m, 15m, etc.).
✅ Scalable VIX Plotting
Option to overlay a scaled VIX line in the same pane or hide it if you use a separate VIX pane.
✅ Persistent State Label
Shows the current regime, timeframe, and key values. Updates every bar without stacking multiple labels.
✅ Alerts Ready
Alerts for each market regime can be set directly in TradingView.
✅ Background Coloring
Quick at-a-glance identification of current state.
🎯 How to Use
Ranging markets (low VIX, low ADX, flat ATR): Favor mean-reversion strategies like option selling, iron condors, or scalping.
Smooth trends (low VIX, high ADX): Favor directional trades with futures/options spreads.
Breakout Watch: Stay alert for possible trend initiation.
Confirmed trends (neutral VIX, high ADX, rising ATR): Ideal for momentum trading.
Volatile trends (high VIX, high ADX): Use caution, hedge positions, or trade with wider stops.
Choppy/Noisy (high VIX, low ADX): Avoid overtrading, expect false signals.
Optimized ADX DI CCI Strategy### Key Features:
- Combines ADX, DI+/-, CCI, and RSI for signal generation.
- Supports customizable timeframes for indicators.
- Offers multiple exit conditions (Moving Average cross, ADX change, performance-based stop-loss).
- Tracks and displays trade statistics (e.g., win rate, capital growth, profit factor).
- Visualizes trades with labels and optional background coloring.
- Allows countertrading (opening an opposite trade after closing one).
1. **Indicator Calculation**:
- **ADX and DI+/-**: Calculated using the `ta.dmi` function with user-defined lengths for DI and ADX smoothing.
- **CCI**: Computed using the `ta.cci` function with a configurable source (default: `hlc3`) and length.
- **RSI (optional)**: Calculated using the `ta.rsi` function to filter overbought/oversold conditions.
- **Moving Averages**: Used for CCI signal smoothing and trade exits, with support for SMA, EMA, SMMA (RMA), WMA, and VWMA.
2. **Signal Generation**:
- **Buy Signal**: Triggered when DI+ > DI- (or DI+ crosses over DI-), CCI > MA (or CCI crosses over MA), and optional ADX/RSI filters are satisfied.
- **Sell Signal**: Triggered when DI+ < DI- (or DI- crosses over DI+), CCI < MA (or CCI crosses under MA), and optional ADX/RSI filters are satisfied.
3. **Trade Execution**:
- **Entry**: Long or short trades are opened using `strategy.entry` when signals are detected, provided trading is allowed (`allow_long`/`allow_short`) and equity is positive.
- **Exit**: Trades can be closed based on:
- Opposite signal (if no other exit conditions are used).
- MA cross (price crossing below/above the exit MA for long/short trades).
- ADX percentage change exceeding a threshold.
- Performance-based stop-loss (trade loss exceeding a percentage).
- **Countertrading**: If enabled, closing a trade triggers an opposite trade (e.g., closing a long opens a short).
4. **Visualization**:
- Labels are plotted at trade entries/exits (e.g., "BUY," "SELL," arrows).
- Optional background coloring highlights open trades (green for long, red for short).
- A statistics table displays real-time metrics (e.g., capital, win rates).
5. **Trade Tracking**:
- Tracks the number of long/short trades, wins, and overall performance.
- Monitors equity to prevent trading if it falls to zero.
### 2.3 Key Components
- **Indicator Calculations**: Uses `request.security` to fetch indicator data for the specified timeframe.
- **MA Function**: A custom `ma_func` handles different MA types for CCI and exit conditions.
- **Signal Logic**: Combines crossover/under checks with recent bar windows for flexibility.
- **Exit Conditions**: Multiple configurable exit strategies for risk management.
- **Statistics Table**: Updates dynamically with trade and capital metrics.
## 3. Configuration Options
The script provides extensive customization through input parameters, grouped for clarity in the TradingView settings panel. Below is a detailed breakdown of each setting and its impact.
### 3.1 Strategy Settings (Global)
- **Initial Capital**: Default `10000`. Sets the starting capital for backtesting.
- **Effect**: Determines the base equity for calculating position sizes and performance metrics.
- **Default Quantity Type**: `strategy.percent_of_equity` (50% of equity).
- **Effect**: Controls the size of each trade as a percentage of available equity.
- **Pyramiding**: Default `2`. Allows up to 2 simultaneous trades in the same direction.
- **Effect**: Enables multiple entries if conditions are met, increasing exposure.
- **Commission**: 0.2% per trade.
- **Effect**: Simulates trading fees, reducing net profit in backtesting.
- **Margin**: 100% for long and short trades.
- **Effect**: Assumes no leverage; adjust for margin trading simulations.
- **Calc on Every Tick**: `true`.
- **Effect**: Ensures real-time signal updates for precise execution.
### 3.2 Indicator Settings
- **Indicator Timeframe** (`indicator_timeframe`):
- **Options**: `""` (chart timeframe), `1`, `5`, `15`, `30`, `60`, `240`, `D`, `W`.
- **Default**: `""` (uses chart timeframe).
- **Effect**: Determines the timeframe for ADX, DI, CCI, and RSI calculations. A higher timeframe reduces noise but may delay signals.
### 3.3 ADX & DI Settings
- **DI Length** (`adx_di_len`):
- **Default**: `30`.
- **Range**: Minimum `1`.
- **Effect**: Sets the period for calculating DI+ and DI-. Longer periods smooth trends but reduce sensitivity.
- **ADX Smoothing Length** (`adx_smooth_len`):
- **Default**: `14`.
- **Range**: Minimum `1`.
- **Effect**: Smooths the ADX calculation. Longer periods produce smoother ADX values.
- **Use ADX Filter** (`use_adx_filter`):
- **Default**: `false`.
- **Effect**: If `true`, requires ADX to exceed the threshold for signals to be valid, filtering out weak trends.
- **ADX Threshold** (`adx_threshold`):
- **Default**: `25`.
- **Range**: Minimum `0`.
- **Effect**: Sets the minimum ADX value for valid signals when the filter is enabled. Higher values restrict trades to stronger trends.
### 3.4 CCI Settings
- **CCI Length** (`cci_length`):
- **Default**: `20`.
- **Range**: Minimum `1`.
- **Effect**: Sets the period for CCI calculation. Longer periods reduce noise but may lag.
- **CCI Source** (`cci_src`):
- **Default**: `hlc3` (average of high, low, close).
- **Effect**: Defines the price data for CCI. `hlc3` is standard, but users can choose other sources (e.g., `close`).
- **CCI MA Type** (`ma_type`):
- **Options**: `SMA`, `EMA`, `SMMA (RMA)`, `WMA`, `VWMA`.
- **Default**: `SMA`.
- **Effect**: Determines the moving average type for CCI signal smoothing. EMA is more responsive; VWMA weights by volume.
- **CCI MA Length** (`ma_length`):
- **Default**: `14`.
- **Range**: Minimum `1`.
- **Effect**: Sets the period for the CCI MA. Longer periods smooth the MA but may delay signals.
### 3.5 RSI Filter Settings
- **Use RSI Filter** (`use_rsi_filter`):
- **Default**: `false`.
- **Effect**: If `true`, applies RSI-based overbought/oversold filters to signals.
- **RSI Length** (`rsi_length`):
- **Default**: `14`.
- **Range**: Minimum `1`.
- **Effect**: Sets the period for RSI calculation. Longer periods reduce sensitivity.
- **RSI Lower Limit** (`rsi_lower_limit`):
- **Default**: `30`.
- **Range**: `0` to `100`.
- **Effect**: Defines the oversold threshold for buy signals. Lower values allow trades in more extreme conditions.
- **RSI Upper Limit** (`rsi_upper_limit`):
- **Default**: `70`.
- **Range**: `0` to `100`.
- **Effect**: Defines the overbought threshold for sell signals. Higher values allow trades in more extreme conditions.
### 3.6 Signal Settings
- **Cross Window** (`cross_window`):
- **Default**: `0`.
- **Range**: `0` to `5` bars.
- **Effect**: Specifies the lookback period for detecting DI+/- or CCI crosses. `0` requires crosses on the current bar; higher values allow recent crosses, increasing signal frequency.
- **Allow Long Trades** (`allow_long`):
- **Default**: `true`.
- **Effect**: Enables/disables new long trades. If `false`, only closing existing longs is allowed.
- **Allow Short Trades** (`allow_short`):
- **Default**: `true`.
- **Effect**: Enables/disables new short trades. If `false`, only closing existing shorts is allowed.
- **Require DI+/DI- Cross for Buy** (`buy_di_cross`):
- **Default**: `true`.
- **Effect**: If `true`, requires a DI+ crossover DI- for buy signals; if `false`, DI+ > DI- is sufficient.
- **Require CCI Cross for Buy** (`buy_cci_cross`):
- **Default**: `true`.
- **Effect**: If `true`, requires a CCI crossover MA for buy signals; if `false`, CCI > MA is sufficient.
- **Require DI+/DI- Cross for Sell** (`sell_di_cross`):
- **Default**: `true`.
- **Effect**: If `true`, requires a DI- crossover DI+ for sell signals; if `false`, DI+ < DI- is sufficient.
- **Require CCI Cross for Sell** (`sell_cci_cross`):
- **Default**: `true`.
- **Effect**: If `true`, requires a CCI crossunder MA for sell signals; if `false`, CCI < MA is sufficient.
- **Countertrade** (`countertrade`):
- **Default**: `true`.
- **Effect**: If `true`, closing a trade triggers an opposite trade (e.g., close long, open short) if allowed.
- **Color Background for Open Trades** (`color_background`):
- **Default**: `true`.
- **Effect**: If `true`, colors the chart background green for long trades and red for short trades.
### 3.7 Exit Settings
- **Use MA Cross for Exit** (`use_ma_exit`):
- **Default**: `true`.
- **Effect**: If `true`, closes trades when the price crosses the exit MA (below for long, above for short).
- **MA Length for Exit** (`ma_exit_length`):
- **Default**: `20`.
- **Range**: Minimum `1`.
- **Effect**: Sets the period for the exit MA. Longer periods delay exits.
- **MA Type for Exit** (`ma_exit_type`):
- **Options**: `SMA`, `EMA`, `SMMA (RMA)`, `WMA`, `VWMA`.
- **Default**: `SMA`.
- **Effect**: Determines the MA type for exit signals. EMA is more responsive; VWMA weights by volume.
- **Use ADX Change Stop-Loss** (`use_adx_stop`):
- **Default**: `false`.
- **Effect**: If `true`, closes trades when the ADX changes by a specified percentage.
- **ADX % Change for Stop-Loss** (`adx_change_percent`):
- **Default**: `5.0`.
- **Range**: Minimum `0.0`, step `0.1`.
- **Effect**: Specifies the percentage change in ADX (vs. previous bar) that triggers a stop-loss. Higher values reduce premature exits.
- **Use Performance Stop-Loss** (`use_perf_stop`):
- **Default**: `false`.
- **Effect**: If `true`, closes trades when the loss exceeds a percentage threshold.
- **Performance Stop-Loss (%)** (`perf_stop_percent`):
- **Default**: `-10.0`.
- **Range**: `-100.0` to `0.0`, step `0.1`.
- **Effect**: Specifies the loss percentage that triggers a stop-loss. More negative values allow larger losses before exiting.
## 4. Visual and Statistical Output
- **Labels**: Displayed at trade entries/exits with arrows (↑ for buy, ↓ for sell) and text ("BUY," "SELL"). A "No Equity" label appears if equity is zero.
- **Background Coloring**: Optionally colors the chart background (green for long, red for short) to indicate open trades.
- **Statistics Table**: Displayed at the top center of the chart, updated on timeframe changes or trade events. Includes:
- **Capital Metrics**: Initial capital, current capital, capital growth (%).
- **Trade Metrics**: Total trades, long/short trades, win rate, long/short win rates, profit factor.
- **Open Trade Status**: Indicates if a long, short, or no trade is open.
## 5. Alerts
- **Buy Signal Alert**: Triggered when `buy_signal` is true ("Cross Buy Signal").
- **Sell Signal Alert**: Triggered when `sell_signal` is true ("Cross Sell Signal").
- **Usage**: Users can set up TradingView alerts to receive notifications for trade signals.

ADX Tide ZonesADX Tide Zones – Adaptive Momentum & Trend Strength Framework
Overview
ADX Tide Zones – Professional is a dynamic trend-strength visualizer designed for traders who want to interpret momentum with precision and context. By combining the Average Directional Index (ADX) with adaptive threshold logic, the indicator segments price action into distinct “tide zones” that reflect varying levels of market strength: Calm, Rising, Strong, and Falling Tides. These zones transform raw ADX readings into an interpretable framework that highlights when markets are consolidating, building momentum, trending strongly, or losing strength.
Unlike standard ADX readings, which can be difficult to interpret in real time, ADX Tide Zones translate momentum shifts into a continuous, color-coded system that traders can instantly read. Whether applied to scalping, intraday, or swing trading, the indicator offers a consistent methodology for identifying actionable opportunities across assets and timeframes.
How It Works
The foundation of ADX Tide Zones lies in momentum analysis via the ADX. By measuring the strength (not direction) of a trend, ADX provides an objective read on when markets are gaining or losing energy. ADX Tide Zones enhances this by applying threshold logic to classify ADX values into four distinct states:
Calm Tide : Low ADX values indicate sideways or consolidating conditions.
Rising Tide : ADX increases past a threshold, signaling momentum building.
Strong Tide : ADX remains elevated, confirming robust and sustained trend strength.
Falling Tide : ADX declines after strength, hinting at exhaustion or early reversal setups.
These states are displayed on the chart through adaptive visualizations (zones, bar colors, or overlays), offering real-time clarity on when to expect expansion, continuation, or contraction in price action.
Interpretation
Trend Analysis : By mapping transitions between tides, traders can instantly gauge whether markets are in accumulation, expansion, or exhaustion phases. Rising/Strong Tides reinforce trend continuation, while Falling Tides highlight weakening conditions.
Volatility & Risk Assessment : Shifts between Calm → Rising Tide often precede volatility expansions. Falling Tides can signal a period of compression or corrective moves, warning traders to manage risk proactively.
Market Context : The indicator does not dictate direction; instead, it overlays strength on top of price action, allowing traders to combine it with directional tools such as moving averages, order blocks, or liquidity zones for confirmation.
Strategy Integration
ADX Tide Zones adapts seamlessly to a wide range of trading strategies by translating momentum dynamics into actionable frameworks:
Trend Following : Traders can align with dominant flows by entering positions when the indicator confirms a Rising Tide or Strong Tide. These conditions signal persistent directional strength, making them ideal for continuation setups. Combining directional bias with ADX confirmation reduces the risk of trading against prevailing momentum.
Breakout Trading : When the market transitions from Calm Tide into a Rising Tide, it often precedes a volatility expansion. This shift highlights breakout conditions where accumulation gives way to impulsive price movement. Traders can use this transition as a timing tool to catch early entries into new momentum phases.
Exhaustion Reversals : Strong Tide phases don’t last forever—when they begin to fade into Falling Tide, it can mark trend fatigue or liquidity exhaustion. This offers contrarian traders an early edge in spotting overextended moves and positioning for corrective pullbacks or full reversals.
Multi-Timeframe Analysis : By overlaying higher timeframe tide zones on intraday or scalping charts, traders can filter noise and trade in alignment with larger flows. For example, combining a daily Rising Tide bias with a 15-minute breakout confirmation can significantly improve entry precision while reducing exposure to false signals.
Advanced Techniques
For traders seeking an extra edge, ADX Tide Zones can be pushed further with advanced methods:
Volume & Liquidity Confirmation : Pair the tide transitions with volume spikes, order flow, or liquidity sweep tools. When directional strength confirmed by the ADX coincides with institutional activity, it validates setups and increases probability of follow-through.
Cross-Asset Synchronization : Momentum rarely exists in isolation. Monitoring tide shifts across correlated instruments (e.g., majors vs. USD, or indices vs. risk assets) can uncover synchronized volatility events. These correlations help traders identify whether a move is isolated noise or part of a broader systemic trend.
Threshold Optimization : The sensitivity of ADX Tide Zones can be fine-tuned for different trading objectives. Lower thresholds heighten responsiveness, capturing micro-moves suitable for scalpers. Higher thresholds filter minor fluctuations, isolating major structural swings that align with swing or position trading.
Contextual Trade Management : Instead of using static stops or targets, traders can adapt risk management dynamically by tracking tide progression. For example, a trade initiated during Rising Tide may remain valid as long as conditions sustain, but partial profits or tighter stops can be applied once the zone shifts to Calm Tide.
Inputs & Customization
ADX Length : Define the lookback period for ADX calculation.
Threshold Levels : Adjust sensitivity for Calm, Rising, Strong, and Falling Tides.
Zone Visualization : Choose between bar coloring, background shading, or overlays.
Color Customization : Configure bullish, bearish, neutral, and tide-specific colors.
Multi-Timeframe Options : Enable tide readings from higher timeframes for confirmation.
Why Use ADX Tide Zones
ADX Tide Zones turns the complexity of momentum analysis into a visual system that highlights when markets are gearing up for moves, trending with conviction, or running out of steam. By combining adaptive ADX interpretation with customizable thresholds, traders can:
Anticipate breakouts before volatility expands.
Confirm the strength behind price trends.
Spot exhaustion phases early to secure profits or prepare for reversals.
Adapt strategies seamlessly between scalping, intraday, and swing trading.
With its balance of simplicity and depth, ADX Tide Zones provides a structured lens for reading market momentum, equipping traders with the clarity needed to execute with discipline and confidence.

Advanced Supertrend ADX Strategy with Highest ReturnOverview
This sophisticated trading strategy combines the proven Supertrend indicator with advanced momentum filters and trend strength analysis to identify high-probability long entries in trending markets.
Key Features
✅ Supertrend-Based Signals: Uses optimized ATR calculations for reliable trend detection
✅ Advanced Momentum Filtering: Multiple proprietary momentum filters ensure entry quality
✅ Trend Strength Validation: ADX-based confirmation prevents false signals in weak trends
✅ Intelligent Risk Management: Dynamic stop-loss system based on price action
✅ Visual Stop Loss Indicators: Clear visual representation of risk levels
How It Works
The strategy enters long positions when:
Supertrend indicator confirms bullish trend reversal
Proprietary momentum conditions align for optimal entry timing
Trend strength exceeds minimum threshold (ADX > 20)
Multiple timeframe momentum filters confirm signal quality
Ideal For
Trending markets (stocks, forex, crypto, indices)
Swing trading timeframes (15m to 4H work best)
Traders seeking systematic, rule-based entries
Risk-conscious traders wanting clear stop levels
Settings
ATR Period: Adjustable for different volatility environments (default: 10)
Supertrend Factor: Fine-tune sensitivity (default: 3.0)
ADX Parameters: Customize trend strength requirements
Performance Notes
Long-only strategy optimized for uptrending markets
Works best in trending conditions, may underperform in choppy markets
Designed for systematic execution with clear entry/exit rules
Disclaimer
Past performance does not guarantee future results. Always use proper risk management and position sizing appropriate for your account size. This is just for education purpose only and not recomanded for trading in s
