OPEN-SOURCE SCRIPT
Supp_Ress_V1
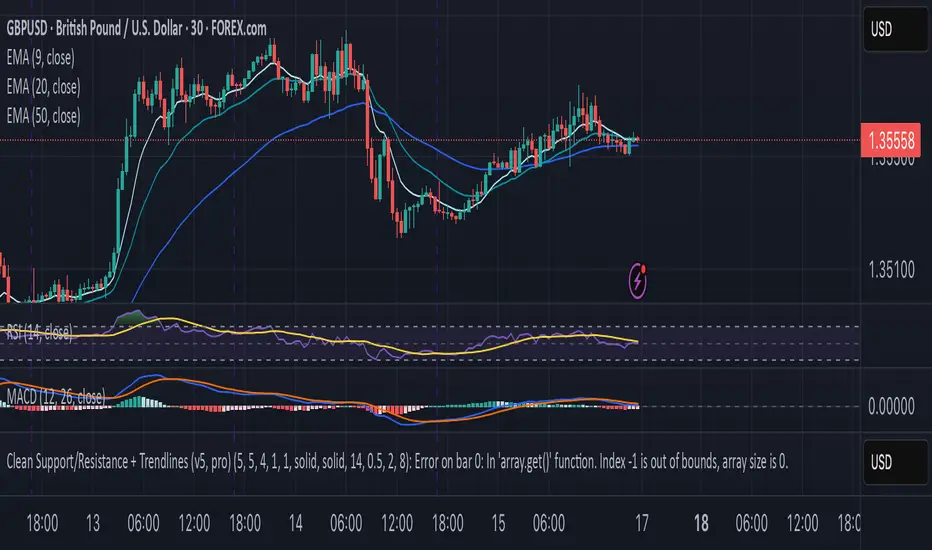
This indicator automatically plots support and resistance levels using confirmed pivot highs and lows, then manages them smartly by merging nearby levels, extending them, and removing them once price breaks through.
It also draws trendlines by connecting valid higher-lows (uptrend) or lower-highs (downtrend), ensuring they slope correctly and have enough spacing between pivots.
In short: it gives you a clean, trader-like map of the most relevant S/R zones and trendlines, updating dynamically as price action unfolds.
สคริปต์โอเพนซอร์ซ
ด้วยเจตนารมณ์หลักของ TradingView ผู้สร้างสคริปต์นี้ได้ทำให้เป็นโอเพนซอร์ส เพื่อให้เทรดเดอร์สามารถตรวจสอบและยืนยันฟังก์ชันการทำงานของมันได้ ขอชื่นชมผู้เขียน! แม้ว่าคุณจะใช้งานได้ฟรี แต่โปรดจำไว้ว่าการเผยแพร่โค้ดซ้ำจะต้องเป็นไปตาม กฎระเบียบการใช้งาน ของเรา
คำจำกัดสิทธิ์ความรับผิดชอบ
ข้อมูลและบทความไม่ได้มีวัตถุประสงค์เพื่อก่อให้เกิดกิจกรรมทางการเงิน, การลงทุน, การซื้อขาย, ข้อเสนอแนะ หรือคำแนะนำประเภทอื่น ๆ ที่ให้หรือรับรองโดย TradingView อ่านเพิ่มเติมใน ข้อกำหนดการใช้งาน