PROTECTED SOURCE SCRIPT
Verified Price Action (Revention)
Welcome to Verified Price Action (VPA), an all-in-one market analysis suite designed to transform you from a signal-follower into a market reader. Instead of providing simple "buy" or "sell" arrows that lack context, VPA uses a unique "cockpit" approach to give you a holistic view of the market's state, empowering you to make more intelligent trading decisions.
The core of this indicator is the Volatility Catalyst Engine, a purely reactive strategy that identifies high-probability momentum continuations. It's built on the principle that the market alternates between balance (consolidation) and imbalance (a decisive move). VPA helps you identify this shift and act only after the new direction has been verified.
The VPA Strategy: How It Works
This indicator doesn't predict; it reacts. It waits for a specific sequence of price action to unfold before alerting you to a potential opportunity.
Market Pause (The Anchor Bar): The script first identifies a period of volatility contraction—an Anchor Bar. This is a small, indecisive candle where the market is pausing and building energy.
Volatility Expansion (The Catalyst Bar): Next, it waits for a strong, impulsive Catalyst Bar to break out from the Anchor Bar's range. This explosive move reveals the market's chosen direction.
Momentum Confirmation: Finally, the script looks for immediate follow-through on the next candle to verify the breakout's strength.
Only when this full sequence is complete does the dashboard update to a "CONFIRMED" state.
Key Features
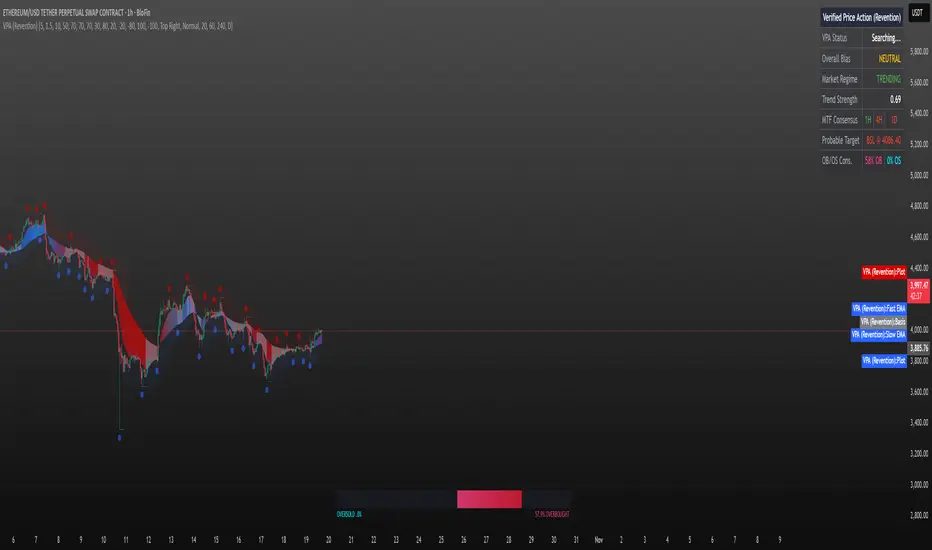
The VPA Cockpit Dashboard: The heart of the indicator. A dynamic status panel tells you exactly where we are in the VPA sequence:
Searching...: Looking for favorable, trending market conditions.
Anchor Detected: A volatility contraction has been found. Pay attention.
Bullish/Bearish Catalyst!: A breakout has occurred. Get ready.
CONFIRMED LONG/SHORT: The breakout has been verified.
Interactive Trend Ribbon: This is more than just a moving average ribbon. It not only displays the current trend direction but also ignites to a bright, vibrant color on a Catalyst Bar, giving you an immediate visual cue that a significant move is underway.
Built-in Market Filters: The VPA engine automatically checks for a Trending Regime and aligns with Higher-Timeframe Consensus, ensuring you are only analyzing setups that are flowing with the broader market current.
Dynamic Liquidity Targets: Automatically plots key buy-side and sell-side liquidity levels based on recent swing points, helping you identify potential targets.
OB/OS Pressure Gauge: A sleek meter at the bottom of the chart provides a consensus view of multiple oscillators, helping you gauge market exhaustion at a glance.
How to Use This Indicator
Check the Environment: First, look at the "Overall Bias" and "Market Regime" on the dashboard. The ideal setup occurs in a "TRENDING" market where your intended direction matches the higher-timeframe bias.
Wait for the "Catalyst!": Monitor the "VPA Status." When it changes to Anchor Detected, it's time to watch closely. The moment it updates to Bullish Catalyst! or Bearish Catalyst! (and the ribbon ignites), you have a potential setup in play.
Make Your Decision on "Confirmed": The final CONFIRMED LONG/SHORT status on the dashboard is your cue that the strategy's conditions have been fully met. Use this information, along with your own analysis, to manage your trade.
This tool was built to help the community trade with more context and confidence. Enjoy!
The core of this indicator is the Volatility Catalyst Engine, a purely reactive strategy that identifies high-probability momentum continuations. It's built on the principle that the market alternates between balance (consolidation) and imbalance (a decisive move). VPA helps you identify this shift and act only after the new direction has been verified.
The VPA Strategy: How It Works
This indicator doesn't predict; it reacts. It waits for a specific sequence of price action to unfold before alerting you to a potential opportunity.
Market Pause (The Anchor Bar): The script first identifies a period of volatility contraction—an Anchor Bar. This is a small, indecisive candle where the market is pausing and building energy.
Volatility Expansion (The Catalyst Bar): Next, it waits for a strong, impulsive Catalyst Bar to break out from the Anchor Bar's range. This explosive move reveals the market's chosen direction.
Momentum Confirmation: Finally, the script looks for immediate follow-through on the next candle to verify the breakout's strength.
Only when this full sequence is complete does the dashboard update to a "CONFIRMED" state.
Key Features
The VPA Cockpit Dashboard: The heart of the indicator. A dynamic status panel tells you exactly where we are in the VPA sequence:
Searching...: Looking for favorable, trending market conditions.
Anchor Detected: A volatility contraction has been found. Pay attention.
Bullish/Bearish Catalyst!: A breakout has occurred. Get ready.
CONFIRMED LONG/SHORT: The breakout has been verified.
Interactive Trend Ribbon: This is more than just a moving average ribbon. It not only displays the current trend direction but also ignites to a bright, vibrant color on a Catalyst Bar, giving you an immediate visual cue that a significant move is underway.
Built-in Market Filters: The VPA engine automatically checks for a Trending Regime and aligns with Higher-Timeframe Consensus, ensuring you are only analyzing setups that are flowing with the broader market current.
Dynamic Liquidity Targets: Automatically plots key buy-side and sell-side liquidity levels based on recent swing points, helping you identify potential targets.
OB/OS Pressure Gauge: A sleek meter at the bottom of the chart provides a consensus view of multiple oscillators, helping you gauge market exhaustion at a glance.
How to Use This Indicator
Check the Environment: First, look at the "Overall Bias" and "Market Regime" on the dashboard. The ideal setup occurs in a "TRENDING" market where your intended direction matches the higher-timeframe bias.
Wait for the "Catalyst!": Monitor the "VPA Status." When it changes to Anchor Detected, it's time to watch closely. The moment it updates to Bullish Catalyst! or Bearish Catalyst! (and the ribbon ignites), you have a potential setup in play.
Make Your Decision on "Confirmed": The final CONFIRMED LONG/SHORT status on the dashboard is your cue that the strategy's conditions have been fully met. Use this information, along with your own analysis, to manage your trade.
This tool was built to help the community trade with more context and confidence. Enjoy!
สคริปต์ที่ได้รับการป้องกัน
สคริปต์นี้ถูกเผยแพร่เป็นแบบ closed-source อย่างไรก็ตาม คุณสามารถใช้ได้อย่างอิสระและไม่มีข้อจำกัดใดๆ – เรียนรู้เพิ่มเติมได้ที่นี่
คำจำกัดสิทธิ์ความรับผิดชอบ
ข้อมูลและบทความไม่ได้มีวัตถุประสงค์เพื่อก่อให้เกิดกิจกรรมทางการเงิน, การลงทุน, การซื้อขาย, ข้อเสนอแนะ หรือคำแนะนำประเภทอื่น ๆ ที่ให้หรือรับรองโดย TradingView อ่านเพิ่มเติมที่ ข้อกำหนดการใช้งาน