OPEN-SOURCE SCRIPT
Money Flow Profile [Angel Algo]
Money Flow Profile
Overview
This indicator is designed to analyze trading activity and identify key supply and demand zones using volume and money flow data. It is an advanced tool for traders who want to incorporate volume profile analysis into their trading strategy, enhancing their ability to spot potential reversal zones and understand market sentiment.
Features
1. Customizable Lookback Period
Description: Users can specify the number of bars to consider in the volume profile calculation, allowing for flexible analysis over different periods.
Functionality: This setting adjusts the depth of historical data analyzed, enabling traders to tailor the indicator to various trading styles and timeframes.
2. Row Size Configuration
Description: This input determines the number of rows (or price levels) displayed in the volume profile.
Functionality: By adjusting the row size, traders can get a more granular or more generalized view of trading activity at different price levels.
3. Data Source Selection
Options: Volume, Money Flow
Description: Traders can choose between using traditional volume data or money flow for the volume profile calculation.
Functionality: Money flow incorporates both price and volume to give a more comprehensive view of market buying and selling pressure, while volume focuses solely on trading activity.
Volume:

Money Flow:

4. Color Gradient for Volume Intensity
Description: The script allows setting maximum and minimum colors to create a gradient that visually represents the intensity of trading activity.
Functionality: This visual aid helps traders quickly identify areas of high and low trading activity, enhancing the interpretability of the volume profile.
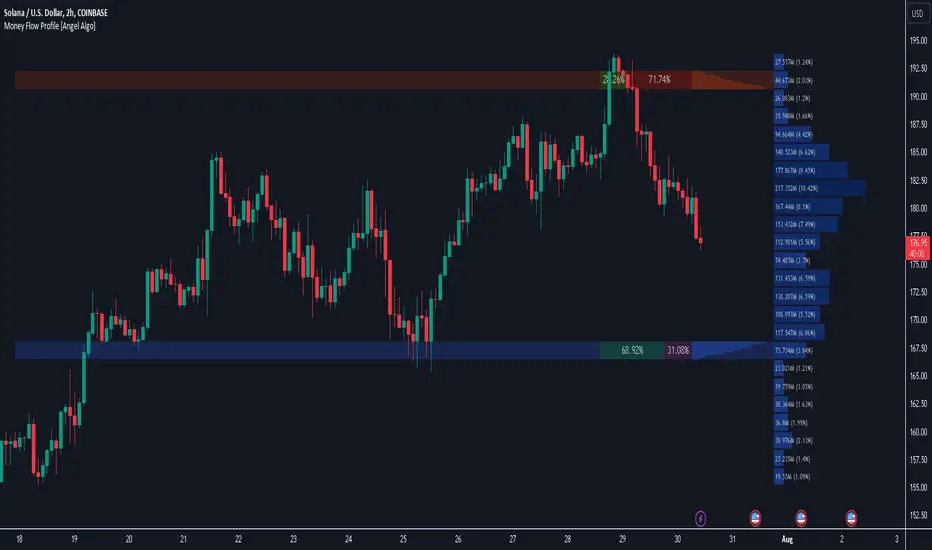
Advanced Analysis: Supply and Demand Zones
1. Sentiment Analysis-Based Zoning
Description: The script analyzes the volume profile bars above and below the current close price to detect zones with significant buying or selling pressure.
Methodology:
Supply Zones: Identified by analyzing bars above the current close and finding the area with the highest selling pressure, indicated by volume delta.
Demand Zones: Identified by analyzing bars below the current close and finding the area with the highest buying pressure.

2. Volume Delta Calculation
Description: Volume delta, the difference between buy and sell volumes, is used to gauge the strength of buying or selling pressure at each price level.
Functionality: This calculation helps pinpoint the most significant supply and demand zones, providing traders with potential entry and exit points based on market sentiment.

Usage Scenario
This indicator is particularly useful for traders who focus on intraday trading, swing trading, or any strategy that benefits from understanding volume dynamics and sentiment at specific price levels. It allows traders to visually assess which levels are likely to act as resistance or support, based on historical trading activity and current market sentiment.
Conclusion
By integrating both traditional and innovative analytical methods, this Indicator offers a powerful tool for market analysis. Its flexibility and depth provide traders with valuable insights into market dynamics.
Overview
This indicator is designed to analyze trading activity and identify key supply and demand zones using volume and money flow data. It is an advanced tool for traders who want to incorporate volume profile analysis into their trading strategy, enhancing their ability to spot potential reversal zones and understand market sentiment.
Features
1. Customizable Lookback Period
Description: Users can specify the number of bars to consider in the volume profile calculation, allowing for flexible analysis over different periods.
Functionality: This setting adjusts the depth of historical data analyzed, enabling traders to tailor the indicator to various trading styles and timeframes.
2. Row Size Configuration
Description: This input determines the number of rows (or price levels) displayed in the volume profile.
Functionality: By adjusting the row size, traders can get a more granular or more generalized view of trading activity at different price levels.
3. Data Source Selection
Options: Volume, Money Flow
Description: Traders can choose between using traditional volume data or money flow for the volume profile calculation.
Functionality: Money flow incorporates both price and volume to give a more comprehensive view of market buying and selling pressure, while volume focuses solely on trading activity.
Volume:
Money Flow:
4. Color Gradient for Volume Intensity
Description: The script allows setting maximum and minimum colors to create a gradient that visually represents the intensity of trading activity.
Functionality: This visual aid helps traders quickly identify areas of high and low trading activity, enhancing the interpretability of the volume profile.
Advanced Analysis: Supply and Demand Zones
1. Sentiment Analysis-Based Zoning
Description: The script analyzes the volume profile bars above and below the current close price to detect zones with significant buying or selling pressure.
Methodology:
Supply Zones: Identified by analyzing bars above the current close and finding the area with the highest selling pressure, indicated by volume delta.
Demand Zones: Identified by analyzing bars below the current close and finding the area with the highest buying pressure.
2. Volume Delta Calculation
Description: Volume delta, the difference between buy and sell volumes, is used to gauge the strength of buying or selling pressure at each price level.
Functionality: This calculation helps pinpoint the most significant supply and demand zones, providing traders with potential entry and exit points based on market sentiment.
Usage Scenario
This indicator is particularly useful for traders who focus on intraday trading, swing trading, or any strategy that benefits from understanding volume dynamics and sentiment at specific price levels. It allows traders to visually assess which levels are likely to act as resistance or support, based on historical trading activity and current market sentiment.
Conclusion
By integrating both traditional and innovative analytical methods, this Indicator offers a powerful tool for market analysis. Its flexibility and depth provide traders with valuable insights into market dynamics.
สคริปต์โอเพนซอร์ซ
ด้วยเจตนารมณ์หลักของ TradingView ผู้สร้างสคริปต์นี้ได้ทำให้เป็นโอเพนซอร์ส เพื่อให้เทรดเดอร์สามารถตรวจสอบและยืนยันฟังก์ชันการทำงานของมันได้ ขอชื่นชมผู้เขียน! แม้ว่าคุณจะใช้งานได้ฟรี แต่โปรดจำไว้ว่าการเผยแพร่โค้ดซ้ำจะต้องเป็นไปตาม กฎระเบียบการใช้งาน ของเรา
Access our exclusive tools at: angelalgo.com
Join our community via discord.gg/FGUTfkmYbW
All content from AngelAlgo is for informational and educational purposes only. Please note that past performance does not guarantee future results.
Join our community via discord.gg/FGUTfkmYbW
All content from AngelAlgo is for informational and educational purposes only. Please note that past performance does not guarantee future results.
คำจำกัดสิทธิ์ความรับผิดชอบ
ข้อมูลและบทความไม่ได้มีวัตถุประสงค์เพื่อก่อให้เกิดกิจกรรมทางการเงิน, การลงทุน, การซื้อขาย, ข้อเสนอแนะ หรือคำแนะนำประเภทอื่น ๆ ที่ให้หรือรับรองโดย TradingView อ่านเพิ่มเติมใน ข้อกำหนดการใช้งาน