OPEN-SOURCE SCRIPT
Price vs 10/50DMA (%) — single label
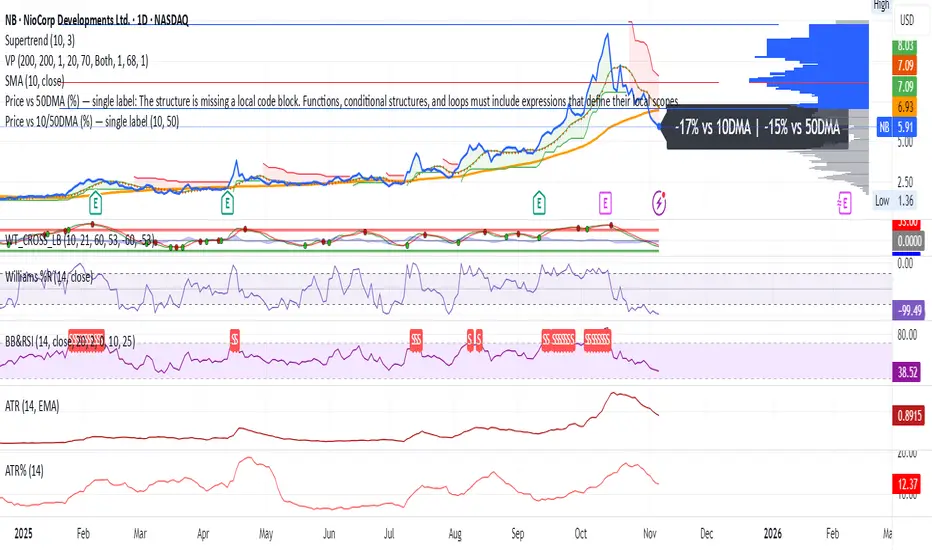
This TradingView script shows how far the current price is from its 10-day and 50-day moving averages (DMAs), expressed as percentages, and displays both values as a single label near the latest candle — for example, “+3% vs 10DMA | +8% vs 50DMA.” You can switch between simple and exponential moving averages using the “Use EMA” checkbox, and adjust the period lengths in the input panel. To use it, simply copy the code into TradingView’s Pine Editor, click Add to chart, and you’ll see one live label updating each bar along with the plotted 10- and 50-day average lines.
สคริปต์โอเพนซอร์ซ
ด้วยเจตนารมณ์หลักของ TradingView ผู้สร้างสคริปต์นี้ได้ทำให้เป็นโอเพนซอร์ส เพื่อให้เทรดเดอร์สามารถตรวจสอบและยืนยันฟังก์ชันการทำงานของมันได้ ขอชื่นชมผู้เขียน! แม้ว่าคุณจะใช้งานได้ฟรี แต่โปรดจำไว้ว่าการเผยแพร่โค้ดซ้ำจะต้องเป็นไปตาม กฎระเบียบการใช้งาน ของเรา
Ex-Fidelity analyst.
Love markets.
Love markets.
คำจำกัดสิทธิ์ความรับผิดชอบ
ข้อมูลและบทความไม่ได้มีวัตถุประสงค์เพื่อก่อให้เกิดกิจกรรมทางการเงิน, การลงทุน, การซื้อขาย, ข้อเสนอแนะ หรือคำแนะนำประเภทอื่น ๆ ที่ให้หรือรับรองโดย TradingView อ่านเพิ่มเติมใน ข้อกำหนดการใช้งาน