PROTECTED SOURCE SCRIPT
ที่อัปเดต: One Punch Homemade MACDonalds

Personal use or with friends.
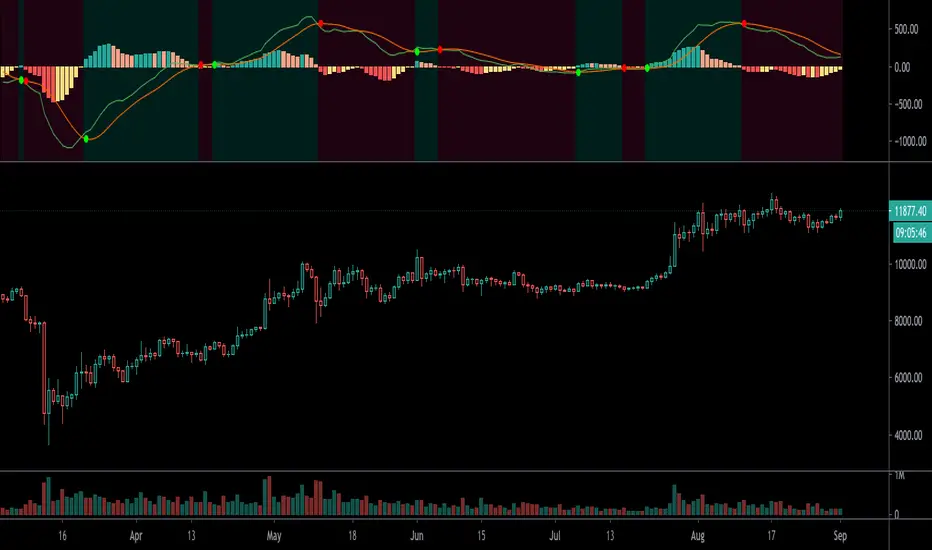
MACD version that has long and short signal at the background good for scalping.
MACD version that has long and short signal at the background good for scalping.
เอกสารเผยแพร่
Customized script with Update Changes.Histogram change or colors
-Green Bullish pattern
-Orange sign of bearish reversal.
-Red bearish pattern
-Yellow sign of bullish reversal
-Changes Lines to Green (Bullish) and Orange (Bearish)
IF green line is above Orange is Bullish
IF orange line is above green is Bearish
-Added Cross points
Green Dot - Bullish cross
Red Dot - Bearish Cross
Also, the background can now indicate Bull and Bear Bias.
Green as Bullish
Magenta as Bearish
สคริปต์ที่ได้รับการป้องกัน
สคริปต์นี้ถูกเผยแพร่เป็นแบบ closed-source อย่างไรก็ตาม คุณสามารถใช้ได้อย่างอิสระและไม่มีข้อจำกัดใดๆ – เรียนรู้เพิ่มเติมได้ที่นี่
คำจำกัดสิทธิ์ความรับผิดชอบ
ข้อมูลและบทความไม่ได้มีวัตถุประสงค์เพื่อก่อให้เกิดกิจกรรมทางการเงิน, การลงทุน, การซื้อขาย, ข้อเสนอแนะ หรือคำแนะนำประเภทอื่น ๆ ที่ให้หรือรับรองโดย TradingView อ่านเพิ่มเติมใน ข้อกำหนดการใช้งาน