PROTECTED SOURCE SCRIPT
ที่อัปเดต: ZTrend

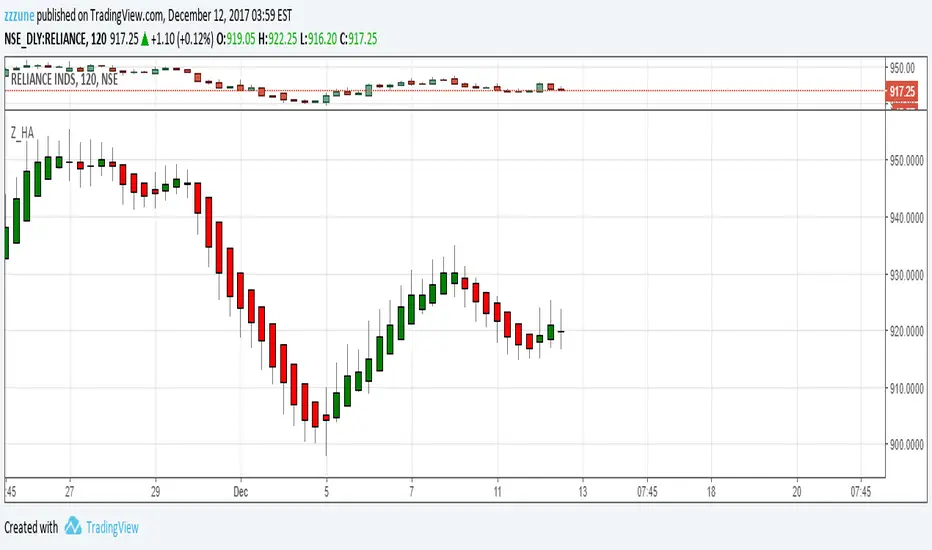
Pick Bottoms and Tops of a trend with ZTrend indicator. Use this indicator in multi frame for superb results.
If you are a Short Term trader, then use 2 hourly and Daily timeframe combination.
So after a downtrend, buy when 2 hourly candle turns green and wait until Daily candle also turns Green. Exit when 2 hourly candle turns red.
Ride the trend and do not exit until the 2 hourly candle turns Red.
When 2 consecutive candle body become thin, means end of a trend is near. Therefore either reduce the position or hedge.
Discipline is the key, therefore exit on the indication and do not wait in hope of marking turning your side.
เอกสารเผยแพร่
study("ZTrend", shorttitle="Z_HA", overlay=false)O = ema(open,3)
H = ema(high,3)
L = ema(low,3)
C = ema(close,3)
haclose = (O + H + L + C) / 4
haopen = na(haopen[1]) ? (O + C) / 2 : (haopen[1] + haclose[1]) / 2
hahigh = max(H, max(haopen, haclose))
halow = min(L, min(haopen, haclose))
plotcandle(haopen, hahigh, halow, haclose, title='Mod_HA', color=(haopen < haclose) ? green : red, wickcolor=gray)
เอกสารเผยแพร่
New update will plot ZTrend on the price chart itself.Use the Show/Hide button beside name of the instrument example show/Hide button just beside "NIFTY, 1D, NSE"
เอกสารเผยแพร่
Actual closing price of each bar now is also plotted in light blue line. This will help give an indication where exactly the actual price is with respect to ZTrend bars.สคริปต์ที่ได้รับการป้องกัน
สคริปต์นี้ถูกเผยแพร่เป็นแบบ closed-source อย่างไรก็ตาม คุณสามารถใช้ได้อย่างอิสระและไม่มีข้อจำกัดใดๆ – เรียนรู้เพิ่มเติมได้ที่นี่
คำจำกัดสิทธิ์ความรับผิดชอบ
ข้อมูลและบทความไม่ได้มีวัตถุประสงค์เพื่อก่อให้เกิดกิจกรรมทางการเงิน, การลงทุน, การซื้อขาย, ข้อเสนอแนะ หรือคำแนะนำประเภทอื่น ๆ ที่ให้หรือรับรองโดย TradingView อ่านเพิ่มเติมใน ข้อกำหนดการใช้งาน
สคริปต์ที่ได้รับการป้องกัน
สคริปต์นี้ถูกเผยแพร่เป็นแบบ closed-source อย่างไรก็ตาม คุณสามารถใช้ได้อย่างอิสระและไม่มีข้อจำกัดใดๆ – เรียนรู้เพิ่มเติมได้ที่นี่
คำจำกัดสิทธิ์ความรับผิดชอบ
ข้อมูลและบทความไม่ได้มีวัตถุประสงค์เพื่อก่อให้เกิดกิจกรรมทางการเงิน, การลงทุน, การซื้อขาย, ข้อเสนอแนะ หรือคำแนะนำประเภทอื่น ๆ ที่ให้หรือรับรองโดย TradingView อ่านเพิ่มเติมใน ข้อกำหนดการใช้งาน