OPEN-SOURCE SCRIPT
LBR-S310ROC @shrilss

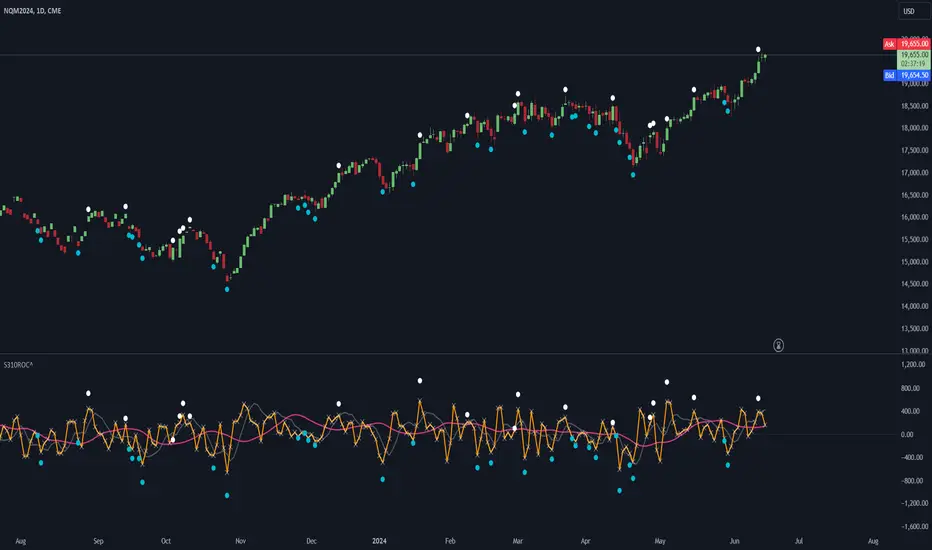
Originally made by Linda Raschke, The S310ROC Indicator combines the Rate of Change (ROC) indicator with the 3-10 Oscillator (Modified MACD) and plots to capture rapid price movements and gauge market momentum.
- Rate of Change (ROC): This component of the indicator measures the percentage change in price over a specified short interval, which can be set by the user (default is 2 days). It is calculated by subtracting the closing price from 'X' days ago from the current close.
- 3-10 Oscillator (MACD; 3,10,16): This is a specialized version of the Moving Average Convergence Divergence (MACD) but uses simple moving averages instead of exponential. Using a fast moving average of 3 days and a slow moving average of 10 days with a smoothing period of 16.
- ROC Dots: A great feature based on the oscillator's readings. Dots are displayed directly on the oscillator or the price chart to provide visual momentum cues:
- Aqua Dots: Appear when all lines (ROC, MACD, Slowline) are sloping downwards, indicating bearish momentum and potentially signaling a sell opportunity.
- White Dots: Appear when all lines are sloping upwards, suggesting bullish momentum and possibly a buy signal.
สคริปต์โอเพนซอร์ซ
ด้วยเจตนารมณ์หลักของ TradingView ผู้สร้างสคริปต์นี้ได้ทำให้เป็นโอเพนซอร์ส เพื่อให้เทรดเดอร์สามารถตรวจสอบและยืนยันฟังก์ชันการทำงานของมันได้ ขอชื่นชมผู้เขียน! แม้ว่าคุณจะใช้งานได้ฟรี แต่โปรดจำไว้ว่าการเผยแพร่โค้ดซ้ำจะต้องเป็นไปตาม กฎระเบียบการใช้งาน ของเรา
คำจำกัดสิทธิ์ความรับผิดชอบ
ข้อมูลและบทความไม่ได้มีวัตถุประสงค์เพื่อก่อให้เกิดกิจกรรมทางการเงิน, การลงทุน, การซื้อขาย, ข้อเสนอแนะ หรือคำแนะนำประเภทอื่น ๆ ที่ให้หรือรับรองโดย TradingView อ่านเพิ่มเติมใน ข้อกำหนดการใช้งาน