OPEN-SOURCE SCRIPT
Average Range Convergence Divergence
Hi there,
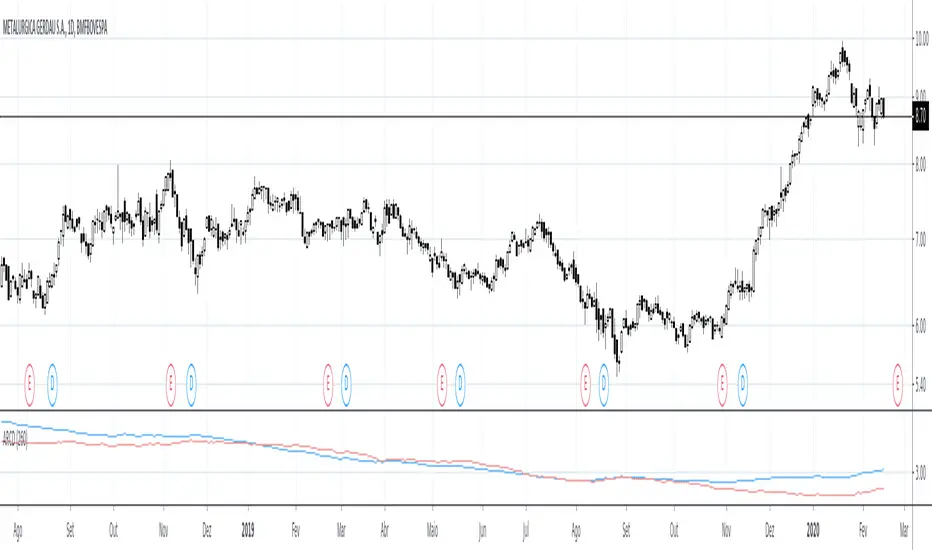
It's a script that plot the ATR (Average True Range) and ADR (Average Day Range) together and do an histogram of it. The histogram is the difference from ATR to ADR, I believe that it shows the average GAP in the asset. So I can easily found the offset to use when defining my stop.
PT
Esse script desenha o ATR (no profit True Range) e o ADR (media da diferença entre máximas e minimas) junto da diferença entre essas médias em formato de histograma. O gap médio de um ativo é mostrado no histograma.
สคริปต์โอเพนซอร์ซ
ด้วยเจตนารมณ์หลักของ TradingView ผู้สร้างสคริปต์นี้ได้ทำให้เป็นโอเพนซอร์ส เพื่อให้เทรดเดอร์สามารถตรวจสอบและยืนยันฟังก์ชันการทำงานของมันได้ ขอชื่นชมผู้เขียน! แม้ว่าคุณจะใช้งานได้ฟรี แต่โปรดจำไว้ว่าการเผยแพร่โค้ดซ้ำจะต้องเป็นไปตาม กฎระเบียบการใช้งาน ของเรา
คำจำกัดสิทธิ์ความรับผิดชอบ
ข้อมูลและบทความไม่ได้มีวัตถุประสงค์เพื่อก่อให้เกิดกิจกรรมทางการเงิน, การลงทุน, การซื้อขาย, ข้อเสนอแนะ หรือคำแนะนำประเภทอื่น ๆ ที่ให้หรือรับรองโดย TradingView อ่านเพิ่มเติมใน ข้อกำหนดการใช้งาน