OPEN-SOURCE SCRIPT
MACD Histogram Multi-Timeframe
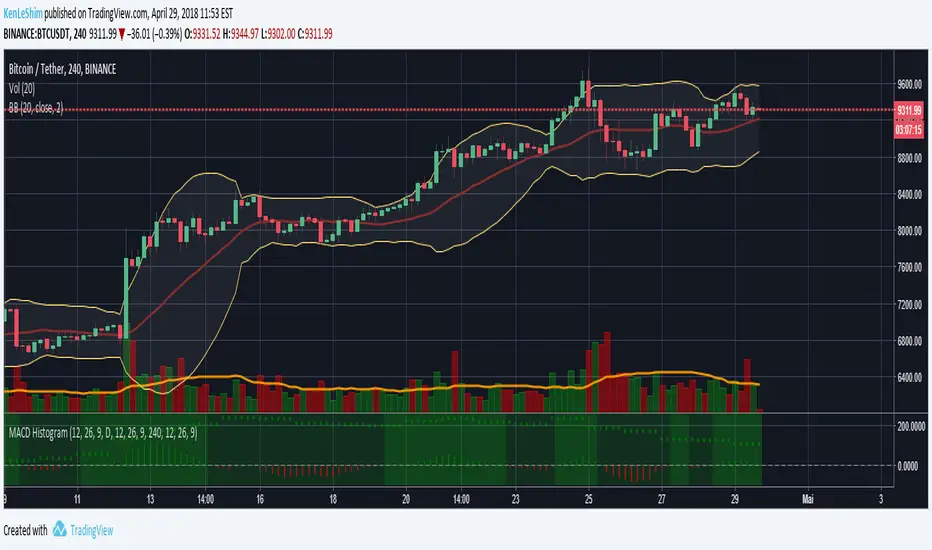
The MACD-Histogram represents the difference between the MACD (i.e., the between the two EMAs) and the signal line (i.e., the 9-day EMA of the MACD). The histogram is positive (i.e., above the zero line) when the MACD is above the signal line and negative when the MACD is below the signal line.
HOW IS IT USED ?
A bullish crossover occurs when the MACD histogram is negative and a bearish cross over occurs when the MACD histogram is negative.
I added the possibility to add on the chart a 2nd timeframe for confirmation.
If you found this script useful, a tip is always welcome... :)
HOW IS IT USED ?
A bullish crossover occurs when the MACD histogram is negative and a bearish cross over occurs when the MACD histogram is negative.
I added the possibility to add on the chart a 2nd timeframe for confirmation.
If you found this script useful, a tip is always welcome... :)
สคริปต์โอเพนซอร์ซ
ด้วยเจตนารมณ์หลักของ TradingView ผู้สร้างสคริปต์นี้ได้ทำให้เป็นโอเพนซอร์ส เพื่อให้เทรดเดอร์สามารถตรวจสอบและยืนยันฟังก์ชันการทำงานของมันได้ ขอชื่นชมผู้เขียน! แม้ว่าคุณจะใช้งานได้ฟรี แต่โปรดจำไว้ว่าการเผยแพร่โค้ดซ้ำจะต้องเป็นไปตาม กฎระเบียบการใช้งาน ของเรา
คำจำกัดสิทธิ์ความรับผิดชอบ
ข้อมูลและบทความไม่ได้มีวัตถุประสงค์เพื่อก่อให้เกิดกิจกรรมทางการเงิน, การลงทุน, การซื้อขาย, ข้อเสนอแนะ หรือคำแนะนำประเภทอื่น ๆ ที่ให้หรือรับรองโดย TradingView อ่านเพิ่มเติมใน ข้อกำหนดการใช้งาน