OPEN-SOURCE SCRIPT
NASDAQ Trading System with Pivots
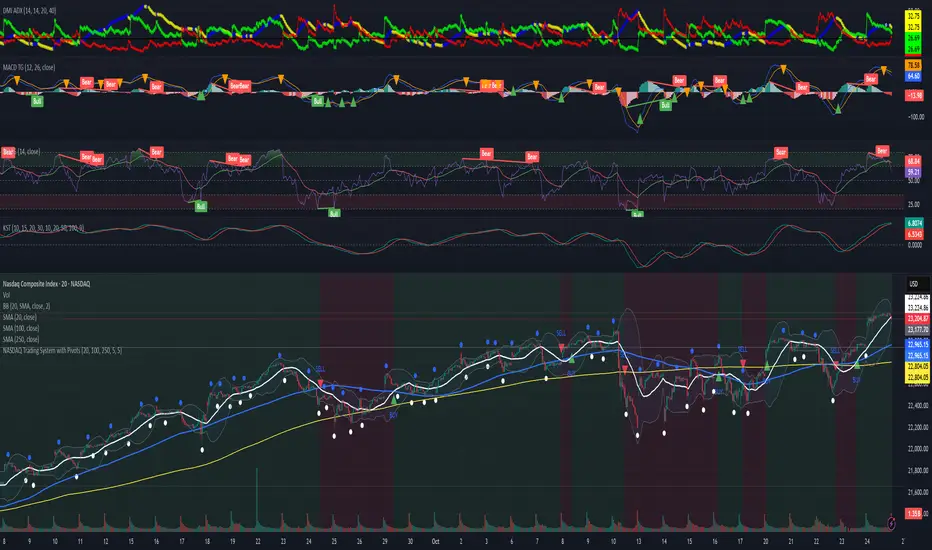
This TradingView indicator, designed for the 30-minute NASDAQ (^IXIC) chart, guides QQQ options trading using a trend-following strategy. It plots a 20-period SMA (blue) and a 100-period SMA (red), with an optional 250-period SMA (orange) inspired by rauItrades' NASDAQ SMA outfit. A bullish crossover (20 SMA > 100 SMA) triggers a green "BUY" triangle below the bar, signaling a potential long position in QQQ, while a bearish crossunder (20 SMA < 100 SMA) shows a red "SELL" triangle above, indicating a short or exit. The background colors green (bullish) or red (bearish) for trend bias. Orange circles (recent highs) and purple circles (recent lows) mark support/resistance levels using 5-bar pivot points.
สคริปต์โอเพนซอร์ซ
ด้วยเจตนารมณ์หลักของ TradingView ผู้สร้างสคริปต์นี้ได้ทำให้เป็นโอเพนซอร์ส เพื่อให้เทรดเดอร์สามารถตรวจสอบและยืนยันฟังก์ชันการทำงานของมันได้ ขอชื่นชมผู้เขียน! แม้ว่าคุณจะใช้งานได้ฟรี แต่โปรดจำไว้ว่าการเผยแพร่โค้ดซ้ำจะต้องเป็นไปตาม กฎระเบียบการใช้งาน ของเรา
คำจำกัดสิทธิ์ความรับผิดชอบ
ข้อมูลและบทความไม่ได้มีวัตถุประสงค์เพื่อก่อให้เกิดกิจกรรมทางการเงิน, การลงทุน, การซื้อขาย, ข้อเสนอแนะ หรือคำแนะนำประเภทอื่น ๆ ที่ให้หรือรับรองโดย TradingView อ่านเพิ่มเติมใน ข้อกำหนดการใช้งาน