PROTECTED SOURCE SCRIPT
Vol%Change
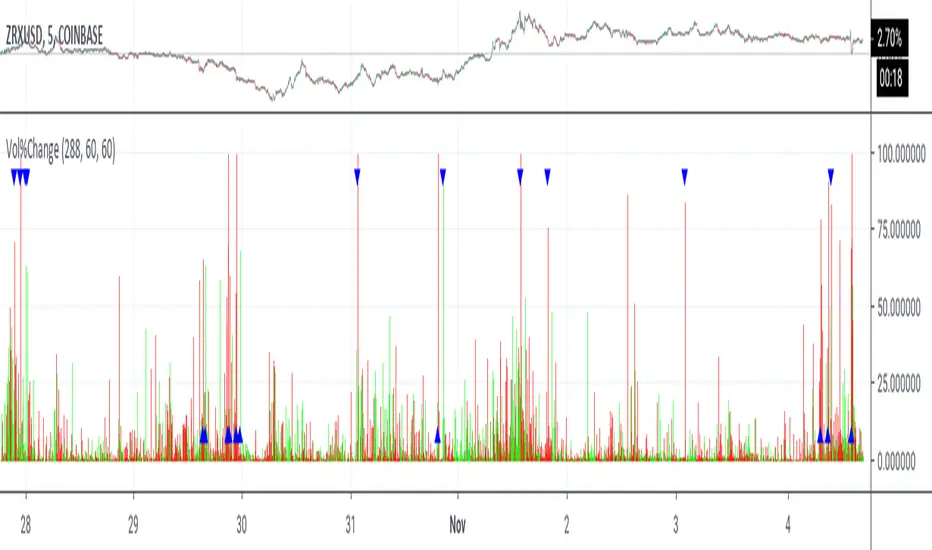
Like its companion study, Bar%Change, this is a visual study to hilight the change in volume by percentage. the percentages are calculated by the duration of the momentum. This study is not designed for automated trading.
The triangles show buys/sells on the basis of momentum. Buys occur below momentum, while sells occur above.
Percentages are shown in red if closing less then opening or closing less then previous closing, otherwise green.
Buying and selling changes in volume percentages are user configurable.
The triangles show buys/sells on the basis of momentum. Buys occur below momentum, while sells occur above.
Percentages are shown in red if closing less then opening or closing less then previous closing, otherwise green.
Buying and selling changes in volume percentages are user configurable.
สคริปต์ที่ได้รับการป้องกัน
สคริปต์นี้ถูกเผยแพร่เป็นแบบ closed-source อย่างไรก็ตาม คุณสามารถใช้ได้อย่างอิสระและไม่มีข้อจำกัดใดๆ – เรียนรู้เพิ่มเติมได้ที่นี่
Join my Patreon for exclusive access to Jackrabbit TV,
patreon.com/RD3277
patreon.com/RD3277
คำจำกัดสิทธิ์ความรับผิดชอบ
ข้อมูลและบทความไม่ได้มีวัตถุประสงค์เพื่อก่อให้เกิดกิจกรรมทางการเงิน, การลงทุน, การซื้อขาย, ข้อเสนอแนะ หรือคำแนะนำประเภทอื่น ๆ ที่ให้หรือรับรองโดย TradingView อ่านเพิ่มเติมใน ข้อกำหนดการใช้งาน