OPEN-SOURCE SCRIPT
ที่อัปเดต: RSI Scalping Gold (XAUUSD) - v5
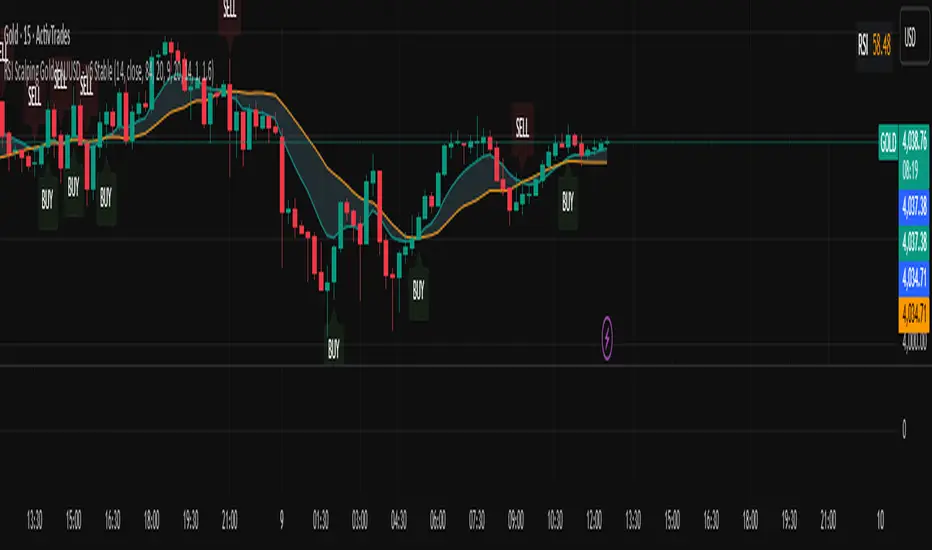
Displays the EMA9 and SMA20 to identify the trend.
Colors the area between the two averages to better visualize the equilibrium zone.
Displays green (buy) and red (sell) arrows aligned with the candles.
The RSI is calculated but hidden from the main chart (you can activate it by checking “Display on chart” in the settings).
Colors the area between the two averages to better visualize the equilibrium zone.
Displays green (buy) and red (sell) arrows aligned with the candles.
The RSI is calculated but hidden from the main chart (you can activate it by checking “Display on chart” in the settings).
เอกสารเผยแพร่
What this version adds:Visible and offset arrows and labels → clearer across all timeframes.
SL/TP directly on the label for each signal.
EMA9/SMA20 zone with transparent sky blue background.
Automatic BUY/SELL alerts as soon as the signal appears.
RSI chart updated in real time.
สคริปต์โอเพนซอร์ซ
ด้วยเจตนารมณ์หลักของ TradingView ผู้สร้างสคริปต์นี้ได้ทำให้มันเป็นโอเพ่นซอร์ส เพื่อให้เทรดเดอร์สามารถตรวจสอบและยืนยันการทำงานของสคริปต์ได้ ขอแสดงความชื่นชมผู้เขียน! แม้ว่าคุณจะสามารถใช้งานได้ฟรี แต่อย่าลืมว่าการเผยแพร่โค้ดซ้ำนั้นจะต้องเป็นไปตามกฎระเบียบการใช้งานของเรา
คำจำกัดสิทธิ์ความรับผิดชอบ
ข้อมูลและบทความไม่ได้มีวัตถุประสงค์เพื่อก่อให้เกิดกิจกรรมทางการเงิน, การลงทุน, การซื้อขาย, ข้อเสนอแนะ หรือคำแนะนำประเภทอื่น ๆ ที่ให้หรือรับรองโดย TradingView อ่านเพิ่มเติมที่ ข้อกำหนดการใช้งาน