OPEN-SOURCE SCRIPT
MARSI
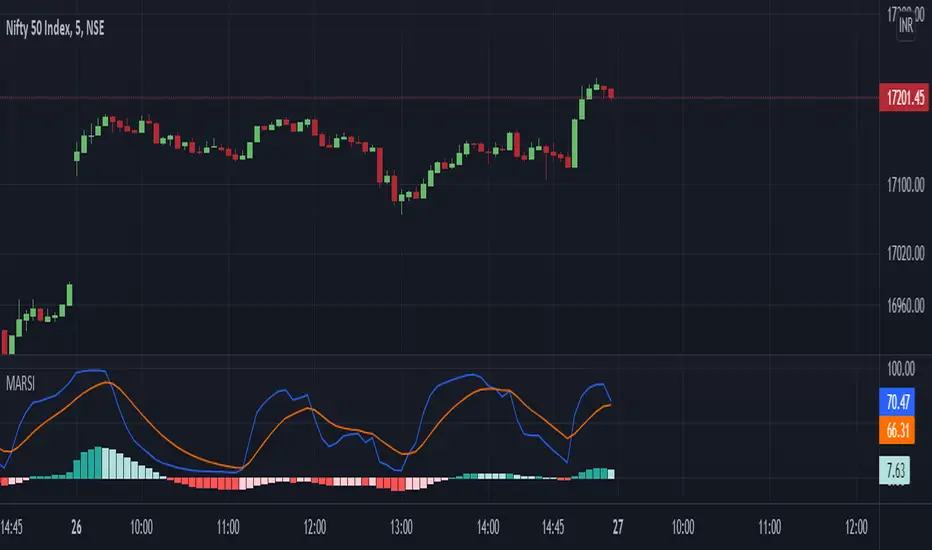
An advanced version of MACD and RSI combined, where moving averages gives quality early signals along with the strength of Histogram. This Version of MACD helps traders to understand strength in the Histogram and possibilities of a reversal. Indicator also gives Early Indications of trend shift.
MACD input options Given to User
The Indicator draws MACD and MACD Histogram
Based on histogram Value RSI is Plotted and RSI Based EMA is Plotted as MARSI line and Signal Line
Calculations :
MACD Line: (12-day EMA - 26-day EMA)
Signal Line: 9-day EMA of MACD Line
MACD Histogram: MACD Line - Signal Line
MARSI Line : RSI Value of MACD Histogram
Signal Line : 9-day EMA of Marsi Line
สคริปต์โอเพนซอร์ซ
ด้วยเจตนารมณ์หลักของ TradingView ผู้สร้างสคริปต์นี้ได้ทำให้เป็นโอเพนซอร์ส เพื่อให้เทรดเดอร์สามารถตรวจสอบและยืนยันฟังก์ชันการทำงานของมันได้ ขอชื่นชมผู้เขียน! แม้ว่าคุณจะใช้งานได้ฟรี แต่โปรดจำไว้ว่าการเผยแพร่โค้ดซ้ำจะต้องเป็นไปตาม กฎระเบียบการใช้งาน ของเรา
Capovex InvTech Limited
คำจำกัดสิทธิ์ความรับผิดชอบ
ข้อมูลและบทความไม่ได้มีวัตถุประสงค์เพื่อก่อให้เกิดกิจกรรมทางการเงิน, การลงทุน, การซื้อขาย, ข้อเสนอแนะ หรือคำแนะนำประเภทอื่น ๆ ที่ให้หรือรับรองโดย TradingView อ่านเพิ่มเติมใน ข้อกำหนดการใช้งาน