OPEN-SOURCE SCRIPT
HTF Candle Insights (Expo)

█ Overview
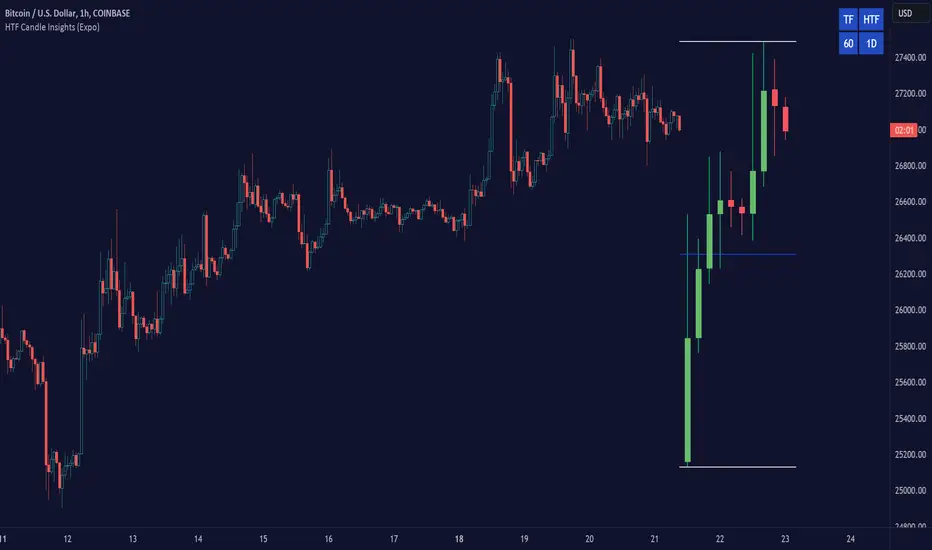
The HTF Candle Insights indicator helps traders see what's happening in larger time frames (HTF) while they're looking at smaller ones. This tool lets traders get a complete picture of market trends and price movements, helping them make smarter trading choices. It's really useful for traders who want to understand the main market trends without constantly switching between different chart timeframes.
In simpler terms, this indicator brings the big picture into the smaller frame, so traders don't miss out on what's important while focusing on the details.

█ How It Works
The indicator plots HTF candles on the existing chart, allowing users to view them concurrently with the candles of the current timeframe. This dual visual representation helps in discerning the prevalent market trends and significant price levels from both the current and higher timeframes.
█ How to Use
Trend Analysis
Traders can leverage this indicator to analyze overall market trends by observing HTF candles alongside the current timeframe candles. Recognizing HTF trends aids in aligning trades with the dominant market movement, potentially increasing the probability of successful trades.

Support and Resistance Identification
By viewing the high, low, and mid-levels of HTF candles, traders can identify potential support and resistance zones, enabling them to establish strategic entry and exit points, place stop-losses effectively, and manage risk proficiently.

█ Settings
Timeframe and Candle Amount:
Visual Adjustments:
Range Lines:
Table Display:
-----------------
Disclaimer
The information contained in my Scripts/Indicators/Ideas/Algos/Systems does not constitute financial advice or a solicitation to buy or sell any securities of any type. I will not accept liability for any loss or damage, including without limitation any loss of profit, which may arise directly or indirectly from the use of or reliance on such information.
All investments involve risk, and the past performance of a security, industry, sector, market, financial product, trading strategy, backtest, or individual's trading does not guarantee future results or returns. Investors are fully responsible for any investment decisions they make. Such decisions should be based solely on an evaluation of their financial circumstances, investment objectives, risk tolerance, and liquidity needs.
My Scripts/Indicators/Ideas/Algos/Systems are only for educational purposes!
The HTF Candle Insights indicator helps traders see what's happening in larger time frames (HTF) while they're looking at smaller ones. This tool lets traders get a complete picture of market trends and price movements, helping them make smarter trading choices. It's really useful for traders who want to understand the main market trends without constantly switching between different chart timeframes.
In simpler terms, this indicator brings the big picture into the smaller frame, so traders don't miss out on what's important while focusing on the details.
█ How It Works
The indicator plots HTF candles on the existing chart, allowing users to view them concurrently with the candles of the current timeframe. This dual visual representation helps in discerning the prevalent market trends and significant price levels from both the current and higher timeframes.
█ How to Use
Trend Analysis
Traders can leverage this indicator to analyze overall market trends by observing HTF candles alongside the current timeframe candles. Recognizing HTF trends aids in aligning trades with the dominant market movement, potentially increasing the probability of successful trades.
Support and Resistance Identification
By viewing the high, low, and mid-levels of HTF candles, traders can identify potential support and resistance zones, enabling them to establish strategic entry and exit points, place stop-losses effectively, and manage risk proficiently.
█ Settings
Timeframe and Candle Amount:
- Users can specify the higher timeframe and the number of HTF candles they wish to visualize on their current chart.
Visual Adjustments:
- Traders can customize the color schemes for upward and downward candles and their wicks, and adjust the visibility and colors of the range lines, allowing for a tailored visual experience.
Range Lines:
- Users have the option to display the high/low range of the displayed candles, and, if preferred, the mid-range line, enabling them to gain insights into significant price levels and ranges.
Table Display:
- The indicator offers the ability to display a table, which provides an overview of the current chart's timeframe and the specified HTF.
-----------------
Disclaimer
The information contained in my Scripts/Indicators/Ideas/Algos/Systems does not constitute financial advice or a solicitation to buy or sell any securities of any type. I will not accept liability for any loss or damage, including without limitation any loss of profit, which may arise directly or indirectly from the use of or reliance on such information.
All investments involve risk, and the past performance of a security, industry, sector, market, financial product, trading strategy, backtest, or individual's trading does not guarantee future results or returns. Investors are fully responsible for any investment decisions they make. Such decisions should be based solely on an evaluation of their financial circumstances, investment objectives, risk tolerance, and liquidity needs.
My Scripts/Indicators/Ideas/Algos/Systems are only for educational purposes!
สคริปต์โอเพนซอร์ซ
ด้วยเจตนารมณ์หลักของ TradingView ผู้สร้างสคริปต์นี้ได้ทำให้เป็นโอเพนซอร์ส เพื่อให้เทรดเดอร์สามารถตรวจสอบและยืนยันฟังก์ชันการทำงานของมันได้ ขอชื่นชมผู้เขียน! แม้ว่าคุณจะใช้งานได้ฟรี แต่โปรดจำไว้ว่าการเผยแพร่โค้ดซ้ำจะต้องเป็นไปตาม กฎระเบียบการใช้งาน ของเรา
Access my indicators at: zeiierman.com
Join Our Free Discord: discord.gg/zeiiermantrading
Join Our Free Discord: discord.gg/zeiiermantrading
คำจำกัดสิทธิ์ความรับผิดชอบ
ข้อมูลและบทความไม่ได้มีวัตถุประสงค์เพื่อก่อให้เกิดกิจกรรมทางการเงิน, การลงทุน, การซื้อขาย, ข้อเสนอแนะ หรือคำแนะนำประเภทอื่น ๆ ที่ให้หรือรับรองโดย TradingView อ่านเพิ่มเติมใน ข้อกำหนดการใช้งาน