PROTECTED SOURCE SCRIPT
ที่อัปเดต: Trend Reversal Alert Hybrid [T.R.A.H]

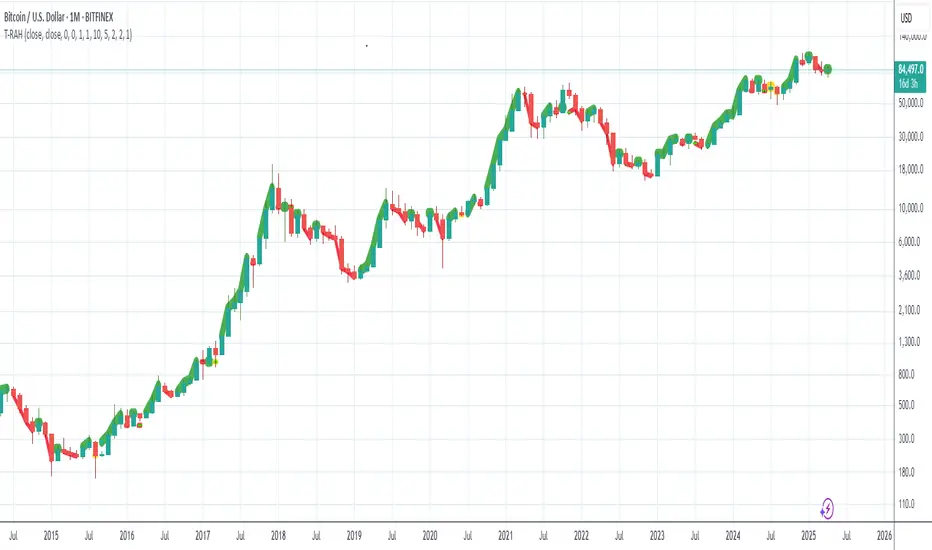
This is extention of a hybrid of AlPos-Trend-Highlighter with Peaks and Bottoms Detector from All Time Fibo Channel.
It is a visualizer of Reversal Points and Trend Lines for the series of a T-R.A.S strategies that are available in my scripts.
* Note : I ended up frustrated, I must say, because when I run my strategy it works perfect, but when I add this visualizer and turn it into strategy for some reason that is beyond of my understanding of pinescript, results are different. I tried everything I could, but in the end decided to make two separately working scripts that one is an indicator and the other one is a strategy. And it's working that way WTH!?!?!? for some reason in SPX lime and aqua lines showed displaced from candles, but when you use it on crypto seems working perfect. Might be a difference in data.. Anyway, please test and comment.
เอกสารเผยแพร่
Updating logic to be as most close to T-R.A.S[lite] as I canเอกสารเผยแพร่
Version update from 2nd to 6th.สคริปต์ที่ได้รับการป้องกัน
สคริปต์นี้ถูกเผยแพร่เป็นแบบ closed-source อย่างไรก็ตาม คุณสามารถใช้ได้อย่างอิสระและไม่มีข้อจำกัดใดๆ – เรียนรู้เพิ่มเติมได้ที่นี่
คำจำกัดสิทธิ์ความรับผิดชอบ
ข้อมูลและบทความไม่ได้มีวัตถุประสงค์เพื่อก่อให้เกิดกิจกรรมทางการเงิน, การลงทุน, การซื้อขาย, ข้อเสนอแนะ หรือคำแนะนำประเภทอื่น ๆ ที่ให้หรือรับรองโดย TradingView อ่านเพิ่มเติมใน ข้อกำหนดการใช้งาน
สคริปต์ที่ได้รับการป้องกัน
สคริปต์นี้ถูกเผยแพร่เป็นแบบ closed-source อย่างไรก็ตาม คุณสามารถใช้ได้อย่างอิสระและไม่มีข้อจำกัดใดๆ – เรียนรู้เพิ่มเติมได้ที่นี่
คำจำกัดสิทธิ์ความรับผิดชอบ
ข้อมูลและบทความไม่ได้มีวัตถุประสงค์เพื่อก่อให้เกิดกิจกรรมทางการเงิน, การลงทุน, การซื้อขาย, ข้อเสนอแนะ หรือคำแนะนำประเภทอื่น ๆ ที่ให้หรือรับรองโดย TradingView อ่านเพิ่มเติมใน ข้อกำหนดการใช้งาน