OPEN-SOURCE SCRIPT
PRICE ACTION TRAKKER
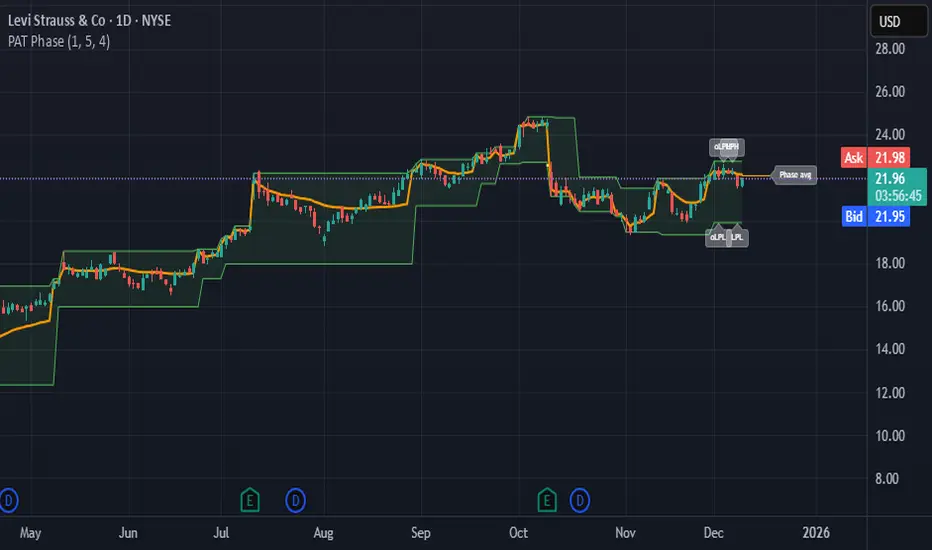
This indicator isolates the core price-phase engine from the full Price Action Tracker (PAT) system.
It identifies and visualises structural phases of price, including:
The phase engine dynamically adapts to evolving market structure using pivot behaviour and structural breaks. This creates a real-time visual map of how price is organising itself — independent of time-based indicators and without the lag associated with classical moving averages.
This version focuses exclusively on price action structure, making it clean, fast, and ideal as a core tool on its own.
However, it is also designed as a foundation for more advanced analysis and will expand over time as additional modules are released.
This phase engine works exceptionally well in combination with my other indicators, such as moving-average structure tools, volume-weighted frameworks, and trend-strength models. Together, they provide a layered view of market behaviour:
phase structure → trend bias → volume confirmation → entry logic.
This makes the indicator valuable for:
Future updates will add modular expansion paths (trend scoring, VWAP phase weighting, multi-phase confluence, and signal logic), while maintaining the simplicity and reliability of this core engine.
Works Best With:
This indicator is part of a broader toolkit designed to analyse structure, trend, and behaviour.
When used alongside my other published tools — such as trend-strength MAs, VWMA frameworks, and higher-timeframe bias indicators — it provides a complete, multi-layered view of market conditions.
It identifies and visualises structural phases of price, including:
- Upper phase boundary (dynamic resistance)
- Lower phase boundary (dynamic support)
- Phase average (mean-reversion anchor)
- Pivot markers (LPH, LPL, oLPH, oLPL)
The phase engine dynamically adapts to evolving market structure using pivot behaviour and structural breaks. This creates a real-time visual map of how price is organising itself — independent of time-based indicators and without the lag associated with classical moving averages.
This version focuses exclusively on price action structure, making it clean, fast, and ideal as a core tool on its own.
However, it is also designed as a foundation for more advanced analysis and will expand over time as additional modules are released.
This phase engine works exceptionally well in combination with my other indicators, such as moving-average structure tools, volume-weighted frameworks, and trend-strength models. Together, they provide a layered view of market behaviour:
phase structure → trend bias → volume confirmation → entry logic.
This makes the indicator valuable for:
- Intra-day and swing traders
- Wyckoff and liquidity-based traders
- Mean-reversion and range-trading strategies
- Understanding where accumulation/distribution behaviour is forming
- Identifying when a phase is likely ending or breaking
Future updates will add modular expansion paths (trend scoring, VWAP phase weighting, multi-phase confluence, and signal logic), while maintaining the simplicity and reliability of this core engine.
Works Best With:
This indicator is part of a broader toolkit designed to analyse structure, trend, and behaviour.
When used alongside my other published tools — such as trend-strength MAs, VWMA frameworks, and higher-timeframe bias indicators — it provides a complete, multi-layered view of market conditions.
สคริปต์โอเพนซอร์ซ
ด้วยเจตนารมณ์หลักของ TradingView ผู้สร้างสคริปต์นี้ได้ทำให้เป็นโอเพนซอร์ส เพื่อให้เทรดเดอร์สามารถตรวจสอบและยืนยันฟังก์ชันการทำงานของมันได้ ขอชื่นชมผู้เขียน! แม้ว่าคุณจะใช้งานได้ฟรี แต่โปรดจำไว้ว่าการเผยแพร่โค้ดซ้ำจะต้องเป็นไปตาม กฎระเบียบการใช้งาน ของเรา
คำจำกัดสิทธิ์ความรับผิดชอบ
ข้อมูลและบทความไม่ได้มีวัตถุประสงค์เพื่อก่อให้เกิดกิจกรรมทางการเงิน, การลงทุน, การซื้อขาย, ข้อเสนอแนะ หรือคำแนะนำประเภทอื่น ๆ ที่ให้หรือรับรองโดย TradingView อ่านเพิ่มเติมใน ข้อกำหนดการใช้งาน