OPEN-SOURCE SCRIPT
Anchored VWAP
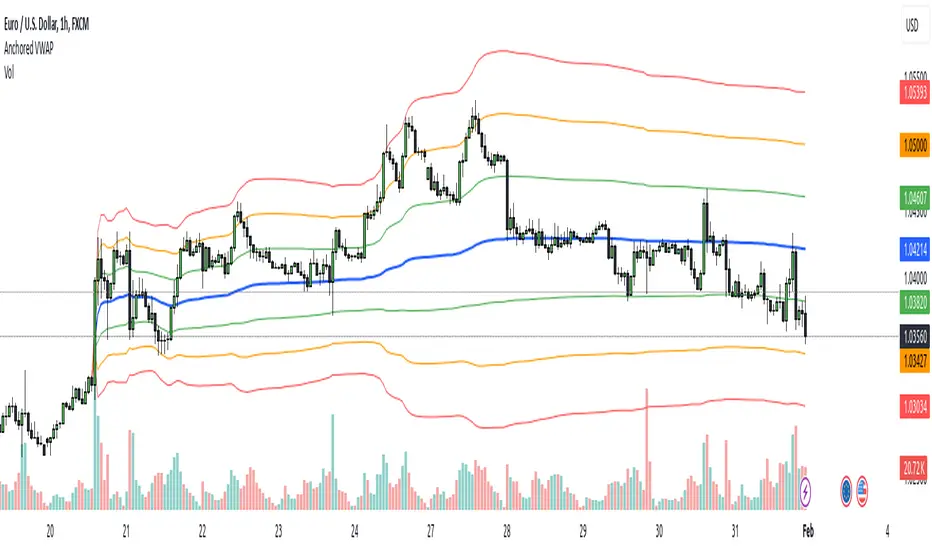
Anchored VWAP with 3 Standard Deviation Bands
📈 Version: Pine Script v5
📌 Author: Aymen Haddaji
🔍 Overview
This indicator calculates an Anchored Volume-Weighted Average Price (AVWAP), allowing traders to anchor the VWAP calculation from a user-defined date and time. It also plots three standard deviation bands above and below the AVWAP to help identify potential areas of overbought and oversold conditions.
📊 Features & Functionality
✔ Custom Anchor Point: Select a specific date and time to start the AVWAP calculation.
✔ OHLC/4 Calculation: Uses the average of Open, High, Low, and Close to smooth the price input.
✔ Three Standard Deviation Bands:
1st Deviation (Green): Moderate volatility zone.
2nd Deviation (Orange): High volatility zone.
3rd Deviation (Red): Extreme overbought/oversold areas.
✔ Real-Time Calculation: Updates dynamically with each price movement.
✔ Clear Visuals:
AVWAP (Blue Line) represents the fair market price from the anchor.
Deviation Bands (Dashed Lines) show potential support and resistance levels.
🛠 How It Works
VWAP Calculation
Uses a cumulative sum of price × volume divided by cumulative volume.
Calculation starts from the user-defined anchor time.
Standard Deviation Bands
Measures the price dispersion around the AVWAP.
The wider the bands, the higher the volatility.
When price touches or exceeds the 3rd deviation, a potential reversal zone is indicated.
Trading Strategies with AVWAP & Deviation Bands
Trend Confirmation:
Price above AVWAP = Uptrend (bullish).
Price below AVWAP = Downtrend (bearish).
Support & Resistance:
AVWAP acts as dynamic support or resistance.
1st & 2nd deviations often act as secondary levels.
Mean Reversion Trading:
When price reaches the 3rd standard deviation, a pullback is likely.
Breakout Confirmation:
A strong close above/below the 3rd deviation may indicate trend continuation.
⚙️ Input Settings
📍 Anchor Time: Allows you to set the exact date and time to start the AVWAP calculation.
🎯 Ideal For
✅ Intraday traders looking for short-term mean reversion plays.
✅ Swing traders identifying key support/resistance zones.
✅ Trend traders confirming long-term market direction.
✅ Volatility traders using standard deviation for trade entries.
สคริปต์โอเพนซอร์ซ
ด้วยเจตนารมณ์หลักของ TradingView ผู้สร้างสคริปต์นี้ได้ทำให้เป็นโอเพนซอร์ส เพื่อให้เทรดเดอร์สามารถตรวจสอบและยืนยันฟังก์ชันการทำงานของมันได้ ขอชื่นชมผู้เขียน! แม้ว่าคุณจะใช้งานได้ฟรี แต่โปรดจำไว้ว่าการเผยแพร่โค้ดซ้ำจะต้องเป็นไปตาม กฎระเบียบการใช้งาน ของเรา
คำจำกัดสิทธิ์ความรับผิดชอบ
ข้อมูลและบทความไม่ได้มีวัตถุประสงค์เพื่อก่อให้เกิดกิจกรรมทางการเงิน, การลงทุน, การซื้อขาย, ข้อเสนอแนะ หรือคำแนะนำประเภทอื่น ๆ ที่ให้หรือรับรองโดย TradingView อ่านเพิ่มเติมใน ข้อกำหนดการใช้งาน