OPEN-SOURCE SCRIPT
Multi-Timeframe 325 SMA Touch
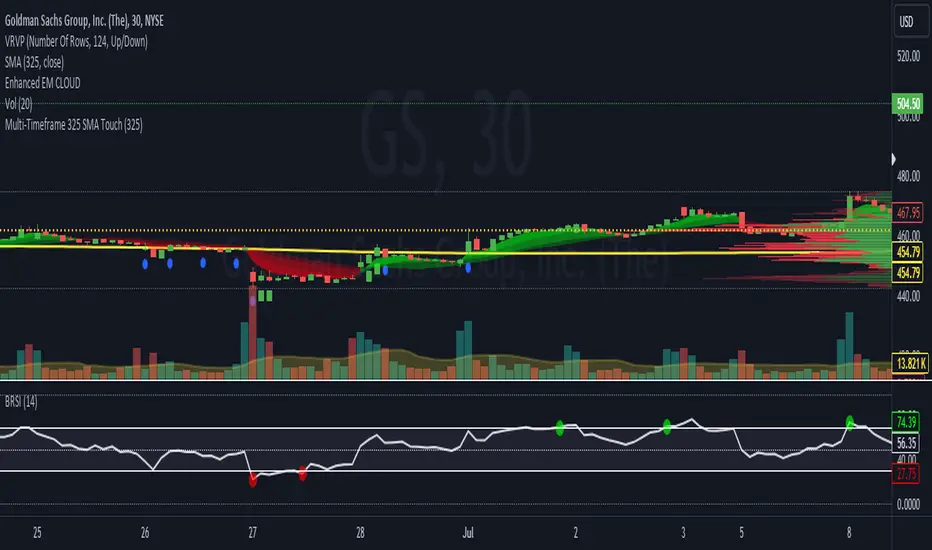
Multi-Timeframe 325 SMA Touch Indicator
This versatile indicator detects and visualizes when the price touches (crosses over or under) the 325-period Simple Moving Average (SMA) across multiple timeframes. It's designed to help traders identify potential support and resistance levels across various time horizons.
Key Features:
Monitors 7 different timeframes: 30 minutes, 1 hour, 2 hours, 4 hours, 6 hours, 12 hours, and 1 day.
Customizable: Each timeframe can be toggled on or off individually.
Visual cues: Unique shapes and colors for each timeframe make it easy to distinguish touches on different time scales.
Adjustable SMA length: While defaulted to 325 periods, the SMA length can be modified to suit your strategy.
Current timeframe SMA: Displays the 325 SMA on the chart for additional context.
How it Works:
The indicator checks for price touches on the 325 SMA for each selected timeframe. When a touch occurs, it plots a distinct shape below the price bar:
30 minutes: Blue circle
1 hour: Green square
2 hours: Red triangle (up)
4 hours: Purple diamond
6 hours: Teal triangle (down)
12 hours: Orange X
1 day: White circle
The 325 SMA for the current chart timeframe is also plotted as a yellow line for reference.
Use Cases:
Identify potential support and resistance levels across multiple timeframes
Spot confluences where touches occur on multiple timeframes simultaneously
Enhance your multi-timeframe analysis for more informed trading decisions
Use as a filter or confirmation tool in your existing trading strategy
Customization:
You can easily customize the indicator by adjusting the SMA length or toggling specific timeframes on/off to focus on the time horizons most relevant to your trading style.
สคริปต์โอเพนซอร์ซ
ด้วยเจตนารมณ์หลักของ TradingView ผู้สร้างสคริปต์นี้ได้ทำให้เป็นโอเพนซอร์ส เพื่อให้เทรดเดอร์สามารถตรวจสอบและยืนยันฟังก์ชันการทำงานของมันได้ ขอชื่นชมผู้เขียน! แม้ว่าคุณจะใช้งานได้ฟรี แต่โปรดจำไว้ว่าการเผยแพร่โค้ดซ้ำจะต้องเป็นไปตาม กฎระเบียบการใช้งาน ของเรา
คำจำกัดสิทธิ์ความรับผิดชอบ
ข้อมูลและบทความไม่ได้มีวัตถุประสงค์เพื่อก่อให้เกิดกิจกรรมทางการเงิน, การลงทุน, การซื้อขาย, ข้อเสนอแนะ หรือคำแนะนำประเภทอื่น ๆ ที่ให้หรือรับรองโดย TradingView อ่านเพิ่มเติมใน ข้อกำหนดการใช้งาน