OPEN-SOURCE SCRIPT
ที่อัปเดต: Aroon Oscillator [bkeevil]
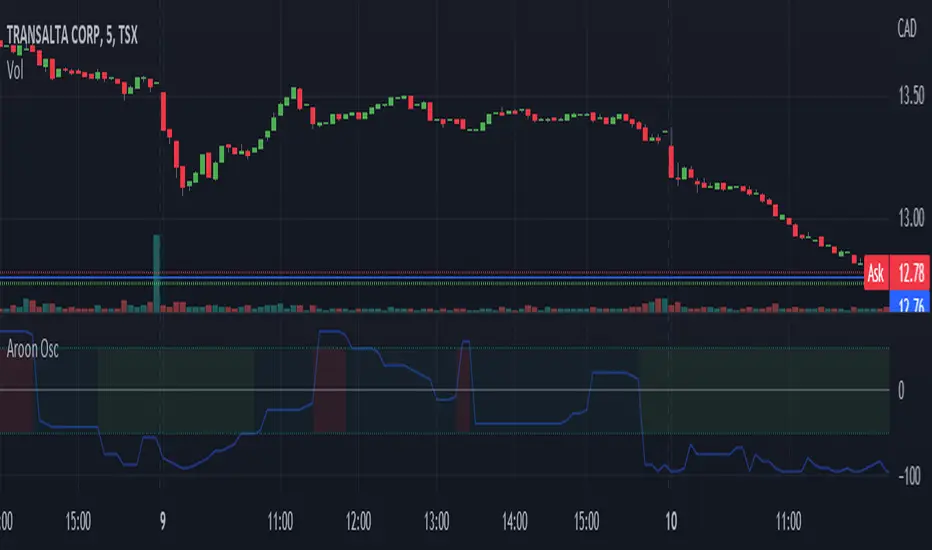
The Aroon Oscillator is intended to highlight short-term trend changes by comparing the number of periods since the last high with the number of periods since the last low.
Since the crossover rules for this oscillator frequently give false signals, I have opted for a more general approach: When the oscillator passes above the 50 line, the background of the indicator will turn green, indicating a general short term buy condition. When the oscillator passes below the -50 line, the background of the indicator will turn red, indicating a general short term sell condition. Use this indicator in combination with other indicators and price signals to identify short term trend changes.
This version improves on existing versions by:
- Adding background colors to indicate general buy/sell conditions
- More visually appealing
- Uses the latest version 5 features
- Well documented source code that conforms to the style guide
เอกสารเผยแพร่
- Turn off indicator overlay mode
- Fix erroneous tooltip
เอกสารเผยแพร่
- Changed the rendering of horizontal lines to use hline() instead of plot()
- Rename Buy/Sell to Uptrend/Downtrend
สคริปต์โอเพนซอร์ซ
ด้วยเจตนารมณ์หลักของ TradingView ผู้สร้างสคริปต์นี้ได้ทำให้เป็นโอเพนซอร์ส เพื่อให้เทรดเดอร์สามารถตรวจสอบและยืนยันฟังก์ชันการทำงานของมันได้ ขอชื่นชมผู้เขียน! แม้ว่าคุณจะใช้งานได้ฟรี แต่โปรดจำไว้ว่าการเผยแพร่โค้ดซ้ำจะต้องเป็นไปตาม กฎระเบียบการใช้งาน ของเรา
คำจำกัดสิทธิ์ความรับผิดชอบ
ข้อมูลและบทความไม่ได้มีวัตถุประสงค์เพื่อก่อให้เกิดกิจกรรมทางการเงิน, การลงทุน, การซื้อขาย, ข้อเสนอแนะ หรือคำแนะนำประเภทอื่น ๆ ที่ให้หรือรับรองโดย TradingView อ่านเพิ่มเติมใน ข้อกำหนดการใช้งาน