OPEN-SOURCE SCRIPT
Drawdown Visualisation
█ OVERVIEW
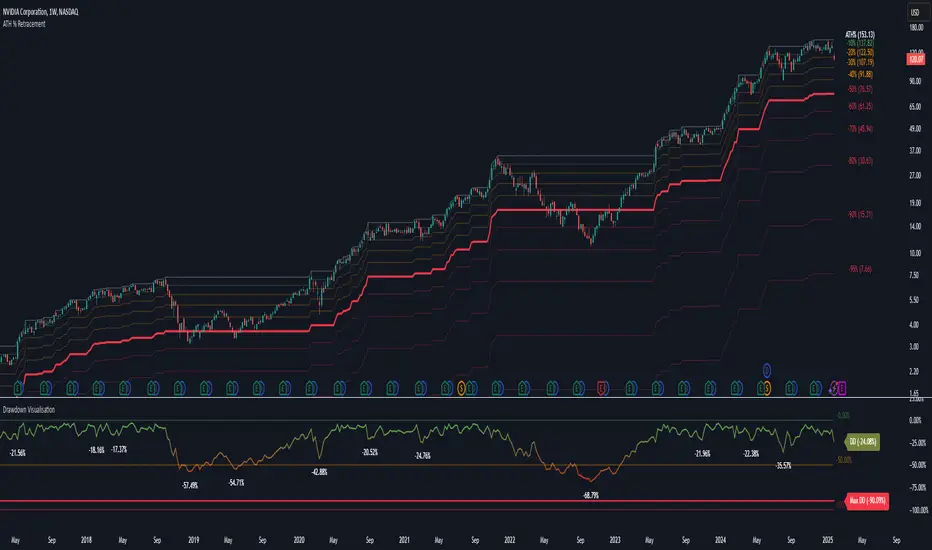
The Drawdown Visualisation indicator calculates and displays the instrument’s drawdown (in percent) relative to its all‐time high (ATH) from a user‐defined start date. It provides customisable options for label appearance, threshold lines (0%, –50%, –100%), and can plot historic drawdown levels via pivot detection.
█ USAGE
This indicator should be used with the Percentage Retracement from ATH indicator.
█ KEY FEATURES
█ PURPOSE
█ IDEAL USERS
The Drawdown Visualisation indicator calculates and displays the instrument’s drawdown (in percent) relative to its all‐time high (ATH) from a user‐defined start date. It provides customisable options for label appearance, threshold lines (0%, –50%, –100%), and can plot historic drawdown levels via pivot detection.
█ USAGE
This indicator should be used with the Percentage Retracement from ATH indicator.
█ KEY FEATURES
- Custom Date Settings — Use a custom start date so that only specified price action is considered.
- Retracement Level Calculation — Determines ATH and computes multiple retracement levels using percentages from 0% to –100%.
- Visual Signals and Customisation — Plots configurable horizontal lines and labels that display retracement percentages and prices.
- Time Filtering — Bases calculations on data from the desired time period.
Historic Drawdowns — Display historical drawdowns
█ PURPOSE
- Assist traders in visualising the depth of price retracements from recent or historical peaks.
- Identify critical zones where the market may find support or resistance after reaching an ATH.
- Facilitate more informed entry and exit decisions by clearly demarcating retracement levels on the chart.
█ IDEAL USERS
- Swing Traders — Looking to exploit pullbacks following strong upward moves.
- Technical Analysts — Interested in pinpointing key retracement levels as potential reversal or continuation points.
- Price Action Traders — Focused on the nuances of market peaks and subsequent corrections.
- Strategy Developers — Keen to backtest and refine approaches centred on retracement dynamics.
สคริปต์โอเพนซอร์ซ
ด้วยเจตนารมณ์หลักของ TradingView ผู้สร้างสคริปต์นี้ได้ทำให้เป็นโอเพนซอร์ส เพื่อให้เทรดเดอร์สามารถตรวจสอบและยืนยันฟังก์ชันการทำงานของมันได้ ขอชื่นชมผู้เขียน! แม้ว่าคุณจะใช้งานได้ฟรี แต่โปรดจำไว้ว่าการเผยแพร่โค้ดซ้ำจะต้องเป็นไปตาม กฎระเบียบการใช้งาน ของเรา
คำจำกัดสิทธิ์ความรับผิดชอบ
ข้อมูลและบทความไม่ได้มีวัตถุประสงค์เพื่อก่อให้เกิดกิจกรรมทางการเงิน, การลงทุน, การซื้อขาย, ข้อเสนอแนะ หรือคำแนะนำประเภทอื่น ๆ ที่ให้หรือรับรองโดย TradingView อ่านเพิ่มเติมใน ข้อกำหนดการใช้งาน