OPEN-SOURCE SCRIPT
Stochastic RSI - WT Confluence Signals (TraderDemircan)
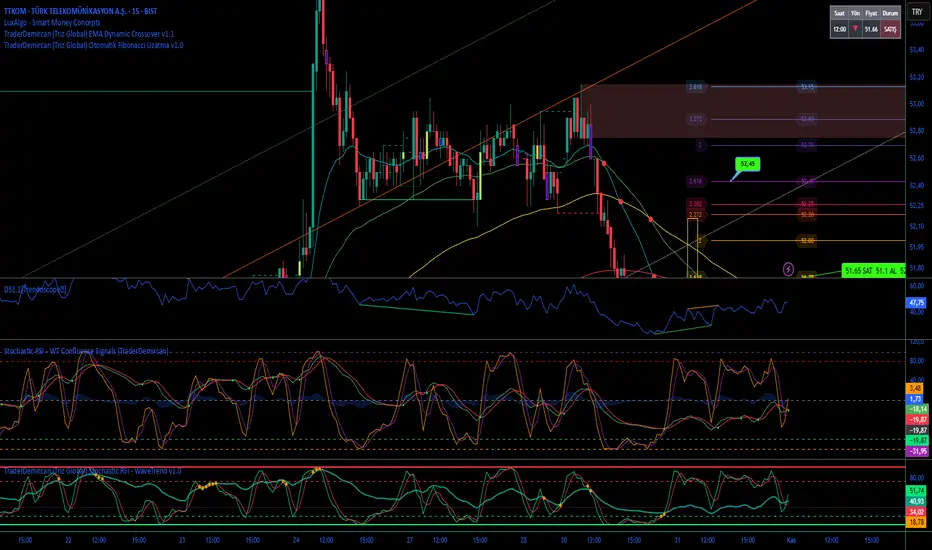
WAVETREND & STOCHASTIC RSI CONFLUENCE SIGNALS
What this indicator does?
This indicator combines WaveTrend and Stochastic RSI oscillators to identify high-probability trading opportunities through confluence signals. It generates alerts when both oscillators simultaneously indicate overbought or oversold conditions with crossovers.
Why combine these two?
- WaveTrend: Detects trend momentum and cycle turning points
- Stochastic RSI: Identifies extreme overbought/oversold levels
- CONFLUENCE: When both agree, signal reliability increases significantly
Unlike simple mashups, this script normalizes Stochastic RSI to WaveTrend's scale (-100 to +100) for easier visual comparison and implements a specific confluence logic.
How it works?
WAVETREND CALCULATION:
- Uses HLC3 average with EMA smoothing
- Channel Length (n1=10) for initial smoothing
- Average Length (n2=21) for trend line
- Overbought zones: +53 to +60 and above
- Oversold zones: -53 to -60 and below
STOCHASTIC RSI CALCULATION:
- RSI Period: 14
- Stochastic Period: 14
- K-Smooth: 3, D-Smooth: 3
- Normalized to -100/+100 range to match WT scale
- Overbought: >80, Oversold: <20
CONFLUENCE SIGNALS:
🔴 SELL: WT crosses down AND both in overbought zones
🟢 BUY: WT crosses up AND both in oversold zones
How to use?
1. Wait for BOTH oscillators to enter extreme zones
2. Look for WaveTrend crossover (green/red circles)
3. Colored bars indicate confluence signals:
• Yellow bars: Potential buy (WT cross up)
• Blue bars: Potential sell (WT cross down)
4. Use with price action and support/resistance for confirmation
Disclaimer
This is not financial advice. Always use proper risk management and combine with other analysis methods. Past performance does not guarantee future results.
═══════════════════════════════════════
สคริปต์โอเพนซอร์ซ
ด้วยเจตนารมณ์หลักของ TradingView ผู้สร้างสคริปต์นี้ได้ทำให้มันเป็นโอเพ่นซอร์ส เพื่อให้เทรดเดอร์สามารถตรวจสอบและยืนยันการทำงานของสคริปต์ได้ ขอแสดงความชื่นชมผู้เขียน! แม้ว่าคุณจะสามารถใช้งานได้ฟรี แต่อย่าลืมว่าการเผยแพร่โค้ดซ้ำนั้นจะต้องเป็นไปตามกฎระเบียบการใช้งานของเรา
คำจำกัดสิทธิ์ความรับผิดชอบ
ข้อมูลและบทความไม่ได้มีวัตถุประสงค์เพื่อก่อให้เกิดกิจกรรมทางการเงิน, การลงทุน, การซื้อขาย, ข้อเสนอแนะ หรือคำแนะนำประเภทอื่น ๆ ที่ให้หรือรับรองโดย TradingView อ่านเพิ่มเติมที่ ข้อกำหนดการใช้งาน