OPEN-SOURCE SCRIPT
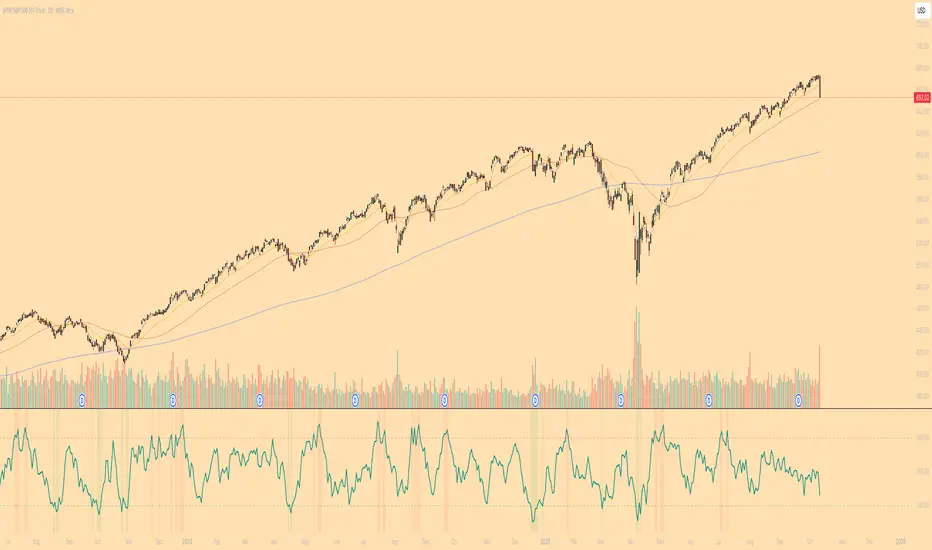
Short-Term Capitulation Oscillator (STCO, Diodato 2019)

Description:
This script is a faithful implementation of the Short-Term Capitulation Oscillator (STCO) from Chris Diodato's 2019 CMT paper, "Making The Most Of Panic". It's a tactical breadth and volume oscillator designed to "fish for market bottoms" by identifying short-term investor capitulation.
What It Is
The STCO combines the 10-day moving averages of NYSE up-volume and advancing issues. It measures the ratio of advancing momentum (in both volume and number of issues) relative to the total traded momentum. The result is a raw, un-normalized oscillator that typically ranges from 0 to 200.
How to Interpret
The STCO is a tactical tool for identifying near-term oversold conditions and potential bounces.
Low Readings: Indicate that sellers have likely exhausted themselves in the short term, creating a potential entry point for a bounce. The paper found that readings below 90, 85, and 80 were often followed by strong market performance over the next 5-20 days.
Overbought/Oversold Lines: Use the customizable overbought/oversold lines to define your own capitulation zones and potential entry areas.
Settings
Data Sources: Allows toggling the use of "Unchanged" issues/volume data.
Thresholds: You can set the overbought and oversold levels based on the paper's research or your own testing.
สคริปต์โอเพนซอร์ซ
ด้วยเจตนารมณ์หลักของ TradingView ผู้สร้างสคริปต์นี้ได้ทำให้เป็นโอเพนซอร์ส เพื่อให้เทรดเดอร์สามารถตรวจสอบและยืนยันฟังก์ชันการทำงานของมันได้ ขอชื่นชมผู้เขียน! แม้ว่าคุณจะใช้งานได้ฟรี แต่โปรดจำไว้ว่าการเผยแพร่โค้ดซ้ำจะต้องเป็นไปตาม กฎระเบียบการใช้งาน ของเรา
คำจำกัดสิทธิ์ความรับผิดชอบ
ข้อมูลและบทความไม่ได้มีวัตถุประสงค์เพื่อก่อให้เกิดกิจกรรมทางการเงิน, การลงทุน, การซื้อขาย, ข้อเสนอแนะ หรือคำแนะนำประเภทอื่น ๆ ที่ให้หรือรับรองโดย TradingView อ่านเพิ่มเติมใน ข้อกำหนดการใช้งาน