OPEN-SOURCE SCRIPT
Gustavo Zone Indicator JULY
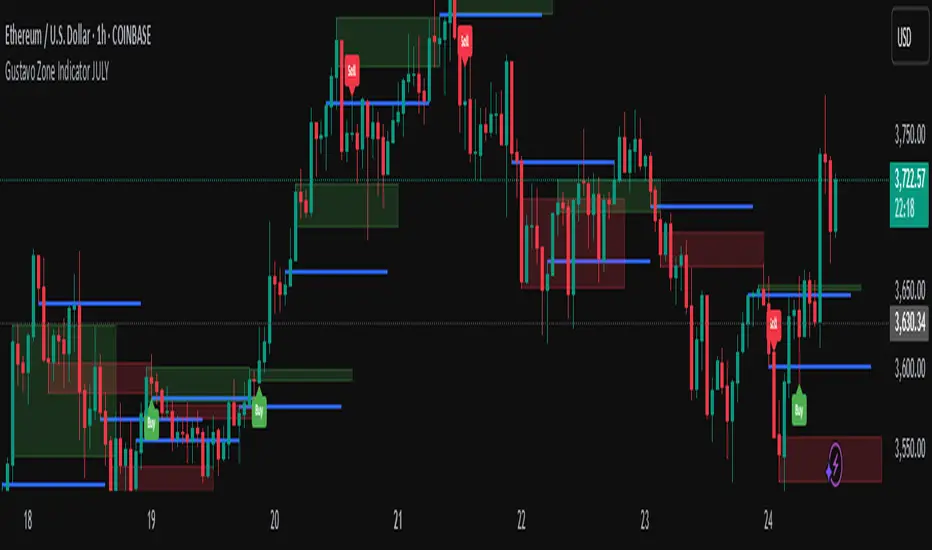
This indicator watches for runs of at least three consecutive green (or red) candles followed by an opposite-color candle, then marks that reversal zone by drawing a rectangle from the wicks of the first two run candles. It optionally plots a horizontal “target” line at the wick of the third run candle. While the zone is active, if three bars in a row close beyond both the zone boundary and the target line, it issues a customizable “Sell” label above the bar (after bullish runs) or a “Buy” label below the bar (after bearish runs). All colors, text labels, sizes, offsets, and toggles for the zones, lines, and signals can be adjusted in the input settings.
สคริปต์โอเพนซอร์ซ
ด้วยเจตนารมณ์หลักของ TradingView ผู้สร้างสคริปต์นี้ได้ทำให้เป็นโอเพนซอร์ส เพื่อให้เทรดเดอร์สามารถตรวจสอบและยืนยันฟังก์ชันการทำงานของมันได้ ขอชื่นชมผู้เขียน! แม้ว่าคุณจะใช้งานได้ฟรี แต่โปรดจำไว้ว่าการเผยแพร่โค้ดซ้ำจะต้องเป็นไปตาม กฎระเบียบการใช้งาน ของเรา
คำจำกัดสิทธิ์ความรับผิดชอบ
ข้อมูลและบทความไม่ได้มีวัตถุประสงค์เพื่อก่อให้เกิดกิจกรรมทางการเงิน, การลงทุน, การซื้อขาย, ข้อเสนอแนะ หรือคำแนะนำประเภทอื่น ๆ ที่ให้หรือรับรองโดย TradingView อ่านเพิ่มเติมใน ข้อกำหนดการใช้งาน