OPEN-SOURCE SCRIPT
Average Directional Index + MA (with Fill trend color)
Description
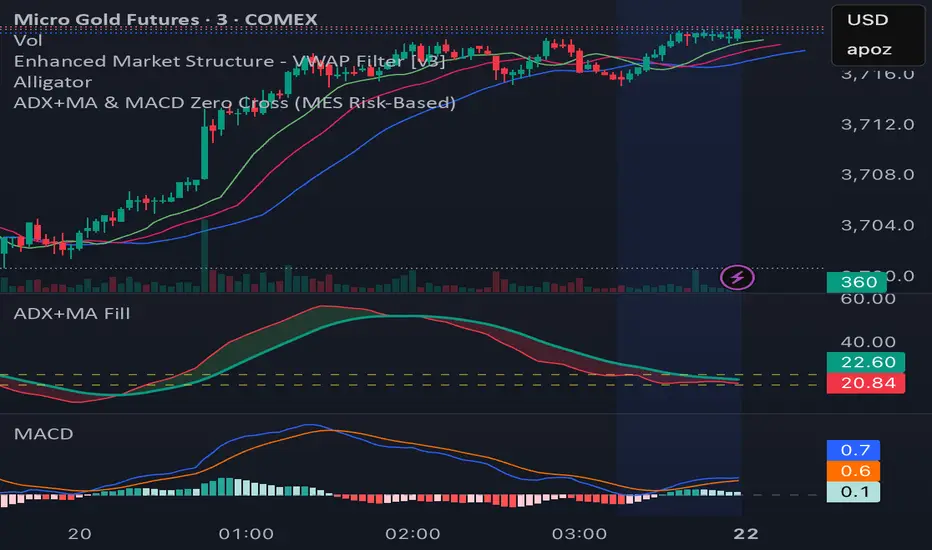
This indicator combines the Average Directional Index (ADX) with a configurable moving average (SMA, EMA, RMA, or WMA) and visual fill. It helps traders assess the strength of a trend by highlighting when ADX is above or below its moving average.
When ADX is rising above the MA, it suggests strengthening momentum; when falling below, it indicates weakening momentum. The dynamic green/red fill makes these transitions easy to spot.
Horizontal threshold levels at 20 and 25 are included as key references:
Below 20 → often signals ranging or sideways/consolidation markets.
Crossing above 20 or 25 → may suggest the beginning of a breakout or trend, useful for trend-following strategies.
How to use
Filter out sideways/consolidation phases and focus on breakout or trend-following opportunities when price action coincides with ADX crossing above the 20/25 thresholds.
Customization
ADX length & smoothing.
Moving average type and length.
Adjustable fill transparency.
Optional threshold lines at 20 and 25.
สคริปต์โอเพนซอร์ซ
ด้วยเจตนารมณ์หลักของ TradingView ผู้สร้างสคริปต์นี้ได้ทำให้มันเป็นโอเพ่นซอร์ส เพื่อให้เทรดเดอร์สามารถตรวจสอบและยืนยันการทำงานของสคริปต์ได้ ขอแสดงความชื่นชมผู้เขียน! แม้ว่าคุณจะสามารถใช้งานได้ฟรี แต่อย่าลืมว่าการเผยแพร่โค้ดซ้ำนั้นจะต้องเป็นไปตามกฎระเบียบการใช้งานของเรา
คำจำกัดสิทธิ์ความรับผิดชอบ
ข้อมูลและบทความไม่ได้มีวัตถุประสงค์เพื่อก่อให้เกิดกิจกรรมทางการเงิน, การลงทุน, การซื้อขาย, ข้อเสนอแนะ หรือคำแนะนำประเภทอื่น ๆ ที่ให้หรือรับรองโดย TradingView อ่านเพิ่มเติมที่ ข้อกำหนดการใช้งาน