PROTECTED SOURCE SCRIPT
Composite RSI2/9
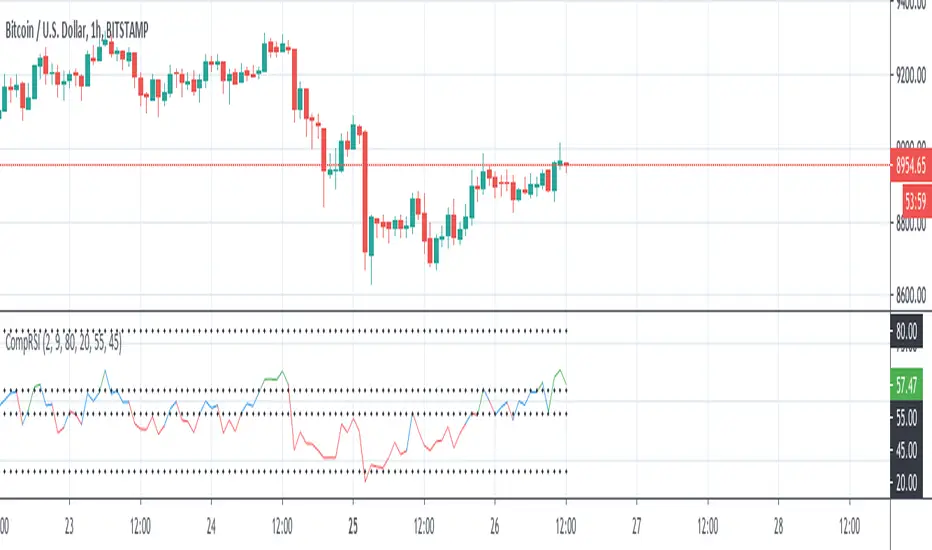
Composite RSI is a new way of calculating the RSI. Unlike the RSI that is a sort of a momentum indicator, composite RSI2/9 is more a trending indicator. It tends to filter out insignificant price changes and seems to be good in identifying the underlying trends.
This indicator shows the average RSI between two periods (default values are 2 and 9) considering the same for multiple timeframes.
For example if the average between RSI2 and RSI9 for 1H and 4H is crssed below static sell level (values is adjustable) it could be read as a signal of down trend.
I suggets to use with higher timeframe.
สคริปต์ที่ได้รับการป้องกัน
สคริปต์นี้ถูกเผยแพร่เป็นแบบ closed-source อย่างไรก็ตาม คุณสามารถใช้ได้อย่างอิสระและไม่มีข้อจำกัดใดๆ – เรียนรู้เพิ่มเติมได้ที่นี่
คำจำกัดสิทธิ์ความรับผิดชอบ
ข้อมูลและบทความไม่ได้มีวัตถุประสงค์เพื่อก่อให้เกิดกิจกรรมทางการเงิน, การลงทุน, การซื้อขาย, ข้อเสนอแนะ หรือคำแนะนำประเภทอื่น ๆ ที่ให้หรือรับรองโดย TradingView อ่านเพิ่มเติมใน ข้อกำหนดการใช้งาน