OPEN-SOURCE SCRIPT
ColorSMA
ColorSMA Indicator – Description & Usage Guide
Overview
The ColorSMA indicator is a dynamic trend-following moving average designed to adapt to volatility and provide clearer visual cues for traders. Unlike a standard simple moving average (SMA), this tool applies a volatility filter using a standard deviation channel and then smooths the price before calculating the moving average.
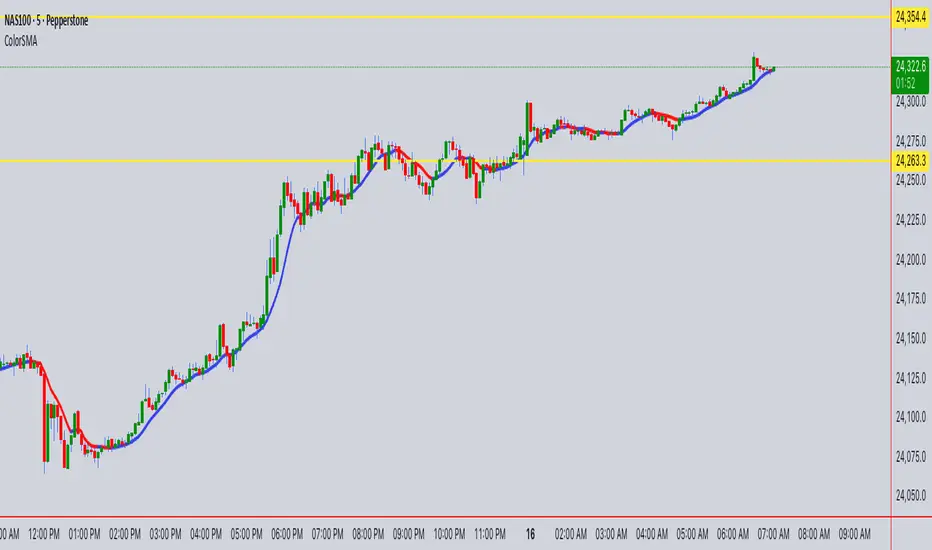
The result is a single line on the chart that changes color depending on its trend direction:
This visual coloring makes it easier to spot the trend direction at a glance.
How It Works
Inputs & Settings
What You See on the Chart
How to Use It
Trend Identification
Entry/Exit Guidance
Volatility Filtering
Smoothing Control
Summary
The ColorSMA is a visually enhanced moving average that adapts to volatility and simplifies trend detection. It is especially useful for traders who prefer:
This indicator is best used as a trend confirmation tool or combined with other strategies such as support/resistance, candlestick patterns, or oscillators for robust trade setups.
Overview
The ColorSMA indicator is a dynamic trend-following moving average designed to adapt to volatility and provide clearer visual cues for traders. Unlike a standard simple moving average (SMA), this tool applies a volatility filter using a standard deviation channel and then smooths the price before calculating the moving average.
The result is a single line on the chart that changes color depending on its trend direction:
- Blue (Uptrend) – The moving average is rising compared to the previous bar.
- Red (Downtrend) – The moving average is falling compared to the previous bar.
This visual coloring makes it easier to spot the trend direction at a glance.
How It Works
- Baseline SMA
- The script first calculates a classic SMA based on the selected Length (default = 9).
- This baseline acts as the foundation of the indicator.
- Volatility Filter (SD Channel)
- A standard deviation multiplier is applied to create an upper and lower channel around the SMA.
- If price moves outside this channel, it gets “clamped” back within the channel range.
- This reduces noise and prevents false signals in highly volatile conditions.
- Smoothed Price (Extra Smooth)
- The filtered price is then smoothed with another SMA (default = 3).
- This step makes the line cleaner and easier to interpret.
- Trend Coloring
- If the current smoothed SMA is higher than its previous value → the line is Blue.
- If it is lower → the line is Red.
- This simple but effective color-coding highlights trend shifts without cluttering the chart.
Inputs & Settings
- Source: The price source used in the calculation (default = close).
- Length: The SMA period length (default = 9).
- Extra Smooth [1=None]: Additional smoothing for the final line (default = 3). Lower values make it more responsive, higher values make it smoother.
- Width (Volatility Filter – SD Channel): The multiplier applied to the standard deviation. Controls how wide the channel is (default = 0.3).
- Length (Volatility Filter – SD Channel): The period for calculating standard deviation (default = 1).
What You See on the Chart
- A single moving average line that changes color:
- Blue (Up) = trend strength or bullish direction.
- Red (Down) = trend weakness or bearish direction.
- The line itself is already filtered through a volatility channel and smoothing, so it reacts to market conditions while reducing noise.
How to Use It
Trend Identification
- Use the color changes (Blue/Red) to quickly identify short-term trend shifts.
- Blue phases suggest bullish bias, Red phases suggest bearish bias.
Entry/Exit Guidance
- Traders can align entries with the trend color (e.g., buy when it turns Blue, sell/short when it turns Red).
- Combine with price action or other indicators for confirmation.
Volatility Filtering
- Adjust the Width and SD Length parameters to tune how sensitive the indicator is to price fluctuations. Narrower channels give more signals; wider channels filter out more noise.
Smoothing Control
- If you prefer faster reactions, lower the smoothing value.
- If you want steadier signals, increase smoothing.
Summary
The ColorSMA is a visually enhanced moving average that adapts to volatility and simplifies trend detection. It is especially useful for traders who prefer:
- Clean charts with minimal clutter.
- Clear, color-coded signals for trend direction.
- Flexibility to adjust responsiveness via smoothing and channel width.
This indicator is best used as a trend confirmation tool or combined with other strategies such as support/resistance, candlestick patterns, or oscillators for robust trade setups.
สคริปต์โอเพนซอร์ซ
ด้วยเจตนารมณ์หลักของ TradingView ผู้สร้างสคริปต์นี้ได้ทำให้เป็นโอเพนซอร์ส เพื่อให้เทรดเดอร์สามารถตรวจสอบและยืนยันฟังก์ชันการทำงานของมันได้ ขอชื่นชมผู้เขียน! แม้ว่าคุณจะใช้งานได้ฟรี แต่โปรดจำไว้ว่าการเผยแพร่โค้ดซ้ำจะต้องเป็นไปตาม กฎระเบียบการใช้งาน ของเรา
I am nothing @shunya.trade
คำจำกัดสิทธิ์ความรับผิดชอบ
ข้อมูลและบทความไม่ได้มีวัตถุประสงค์เพื่อก่อให้เกิดกิจกรรมทางการเงิน, การลงทุน, การซื้อขาย, ข้อเสนอแนะ หรือคำแนะนำประเภทอื่น ๆ ที่ให้หรือรับรองโดย TradingView อ่านเพิ่มเติมใน ข้อกำหนดการใช้งาน