OPEN-SOURCE SCRIPT
Trend Length
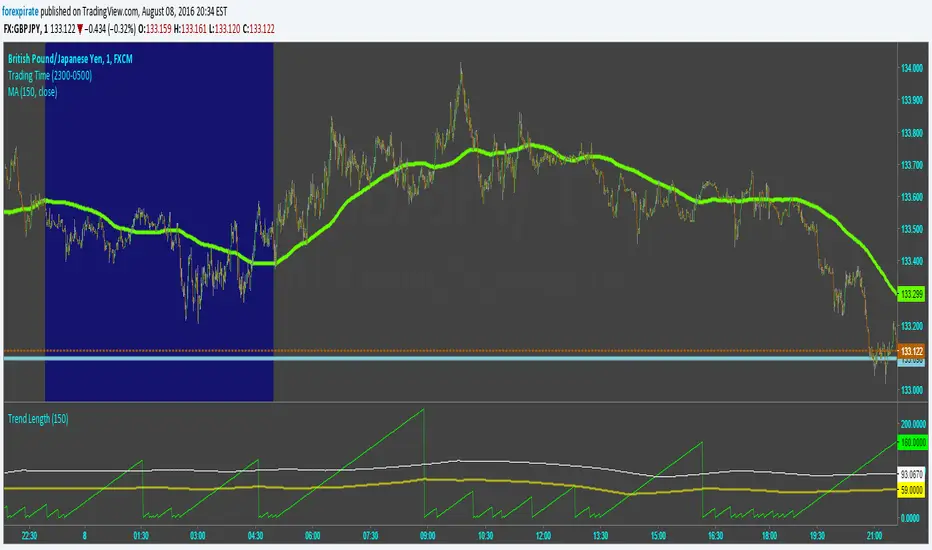
Script tries to capture the length of trends. It calculates an SMA and then determines the slope of the SMA using a simple momentum function. From there it counts bars from when the slope changed directions last. The lime green line is the count from when the slope changed. The yellow line is the average time of a trend. The white line is "trying" to capture the length of a full healthy pip running trend. Pick and SMA you like and then run through many currencies. I find that trends tend to be the same length. Not surprising as the markets are extremely correlated to each other. The trick is to find the most active pair for action. To do that look up my Pairs Range script.
Comments are welcome.
Comments are welcome.
สคริปต์โอเพนซอร์ซ
ด้วยเจตนารมณ์หลักของ TradingView ผู้สร้างสคริปต์นี้ได้ทำให้เป็นโอเพนซอร์ส เพื่อให้เทรดเดอร์สามารถตรวจสอบและยืนยันฟังก์ชันการทำงานของมันได้ ขอชื่นชมผู้เขียน! แม้ว่าคุณจะใช้งานได้ฟรี แต่โปรดจำไว้ว่าการเผยแพร่โค้ดซ้ำจะต้องเป็นไปตาม กฎระเบียบการใช้งาน ของเรา
คำจำกัดสิทธิ์ความรับผิดชอบ
ข้อมูลและบทความไม่ได้มีวัตถุประสงค์เพื่อก่อให้เกิดกิจกรรมทางการเงิน, การลงทุน, การซื้อขาย, ข้อเสนอแนะ หรือคำแนะนำประเภทอื่น ๆ ที่ให้หรือรับรองโดย TradingView อ่านเพิ่มเติมใน ข้อกำหนดการใช้งาน