PROTECTED SOURCE SCRIPT
Trend RSI
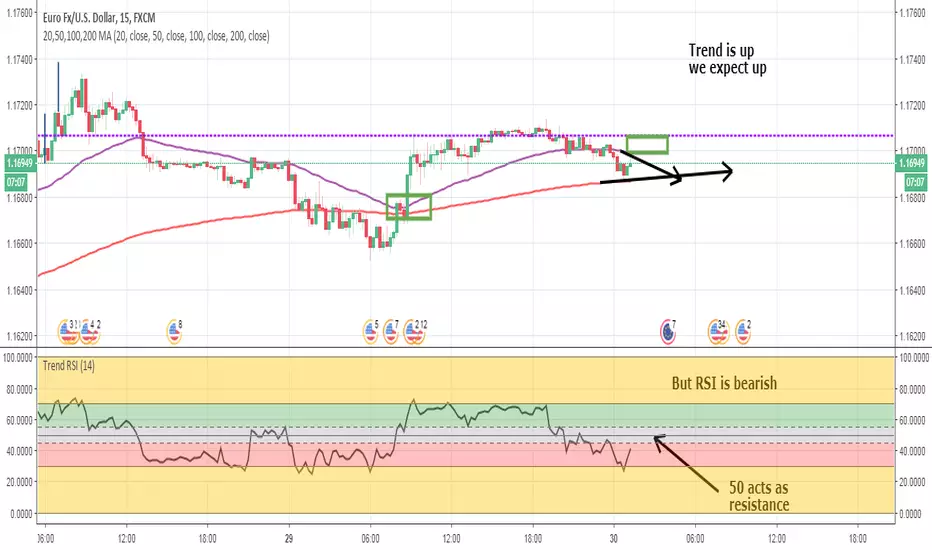
This version of RSI shows the proper levels of how to trade price action.
RSI is more than a reversal tool. It is also a trend following tool.
I've added bands to show Overbought/Oversold.
Above 55 is bullish. Below 45 is bearish.
Do not make any transactions in the 45-55 gray band area.
Coupled with a 50/200 EMA strategy this is more than enough to make a living at trading.
สคริปต์ที่ได้รับการป้องกัน
สคริปต์นี้ถูกเผยแพร่เป็นแบบ closed-source อย่างไรก็ตาม คุณสามารถใช้ได้อย่างอิสระและไม่มีข้อจำกัดใดๆ – เรียนรู้เพิ่มเติมได้ที่นี่
คำจำกัดสิทธิ์ความรับผิดชอบ
ข้อมูลและบทความไม่ได้มีวัตถุประสงค์เพื่อก่อให้เกิดกิจกรรมทางการเงิน, การลงทุน, การซื้อขาย, ข้อเสนอแนะ หรือคำแนะนำประเภทอื่น ๆ ที่ให้หรือรับรองโดย TradingView อ่านเพิ่มเติมใน ข้อกำหนดการใช้งาน