PROTECTED SOURCE SCRIPT
Burt's Multi-EMA Ribbon
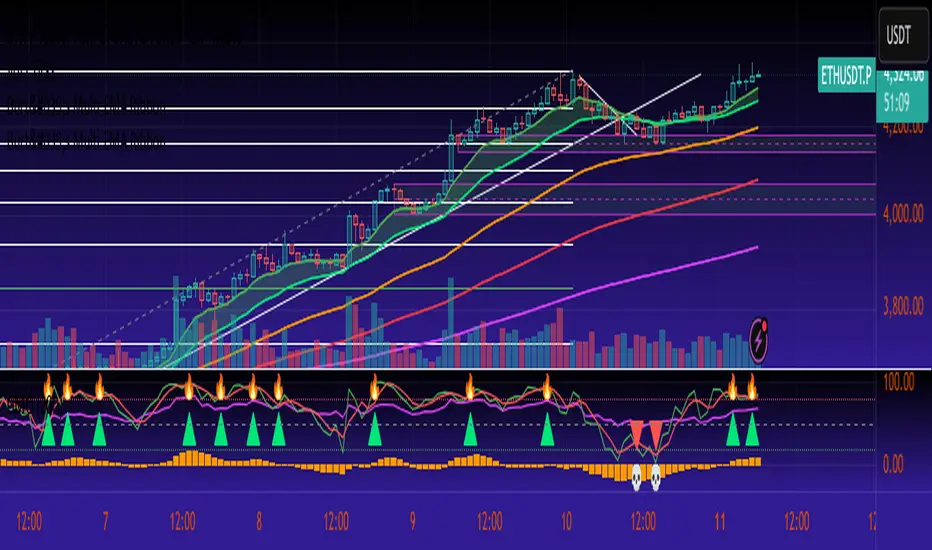
Burt’s Multi-EMA Ribbon is a simple tool for visualising multiple Exponential Moving Averages (EMAs) on the same chart.
It plots the 9, 21, 50, 100, and 200-period EMAs, allowing users to observe their relative positioning. The space between the EMA 9 and EMA 21 is shaded to highlight their relationship.
The script also includes optional alert conditions that notify when EMA 9 moves above or below EMA 21. These features can help traders monitor changes in EMA alignment without constantly watching the chart.
This indicator is intended as an analytical aid and should be used together with other forms of chart analysis. It does not provide buy or sell recommendations.
สคริปต์ที่ได้รับการป้องกัน
สคริปต์นี้ถูกเผยแพร่เป็นแบบ closed-source อย่างไรก็ตาม คุณสามารถใช้ได้อย่างอิสระและไม่มีข้อจำกัดใดๆ – เรียนรู้เพิ่มเติมได้ที่นี่
คำจำกัดสิทธิ์ความรับผิดชอบ
ข้อมูลและบทความไม่ได้มีวัตถุประสงค์เพื่อก่อให้เกิดกิจกรรมทางการเงิน, การลงทุน, การซื้อขาย, ข้อเสนอแนะ หรือคำแนะนำประเภทอื่น ๆ ที่ให้หรือรับรองโดย TradingView อ่านเพิ่มเติมใน ข้อกำหนดการใช้งาน