OPEN-SOURCE SCRIPT
CVD with Trend Line
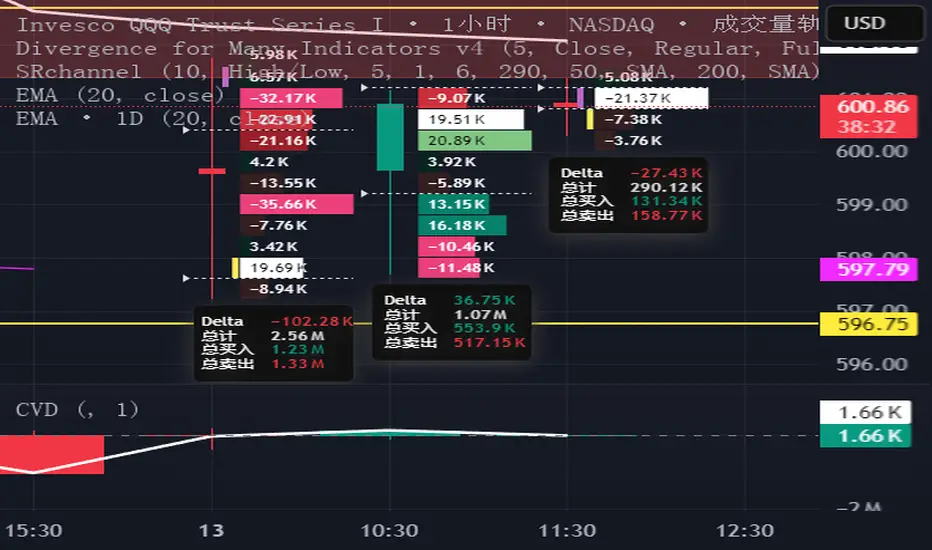
This indicator augments the traditional Cumulative Volume Delta (CVD) by incorporating a customizable trend line that connects the tops of the CVD histogram bars, enhancing visualization of delta trends and market momentum. The CVD measures the net difference between buying and selling volume, utilizing lower timeframe data for accuracy, with configurable anchor periods and timeframe options. The trend line, which can be tailored in both color and style (e.g., solid, dashed), provides traders with a flexible tool to track cumulative delta movements, aiding in the identification of market sentiment shifts. Perfect for volume-based analysis with a clear, adaptable display.
สคริปต์โอเพนซอร์ซ
ด้วยเจตนารมณ์หลักของ TradingView ผู้สร้างสคริปต์นี้ได้ทำให้เป็นโอเพนซอร์ส เพื่อให้เทรดเดอร์สามารถตรวจสอบและยืนยันฟังก์ชันการทำงานของมันได้ ขอชื่นชมผู้เขียน! แม้ว่าคุณจะใช้งานได้ฟรี แต่โปรดจำไว้ว่าการเผยแพร่โค้ดซ้ำจะต้องเป็นไปตาม กฎระเบียบการใช้งาน ของเรา
คำจำกัดสิทธิ์ความรับผิดชอบ
ข้อมูลและบทความไม่ได้มีวัตถุประสงค์เพื่อก่อให้เกิดกิจกรรมทางการเงิน, การลงทุน, การซื้อขาย, ข้อเสนอแนะ หรือคำแนะนำประเภทอื่น ๆ ที่ให้หรือรับรองโดย TradingView อ่านเพิ่มเติมใน ข้อกำหนดการใช้งาน