OPEN-SOURCE SCRIPT
ที่อัปเดต: TKP McClellan Summation Index Stochastics Strategy

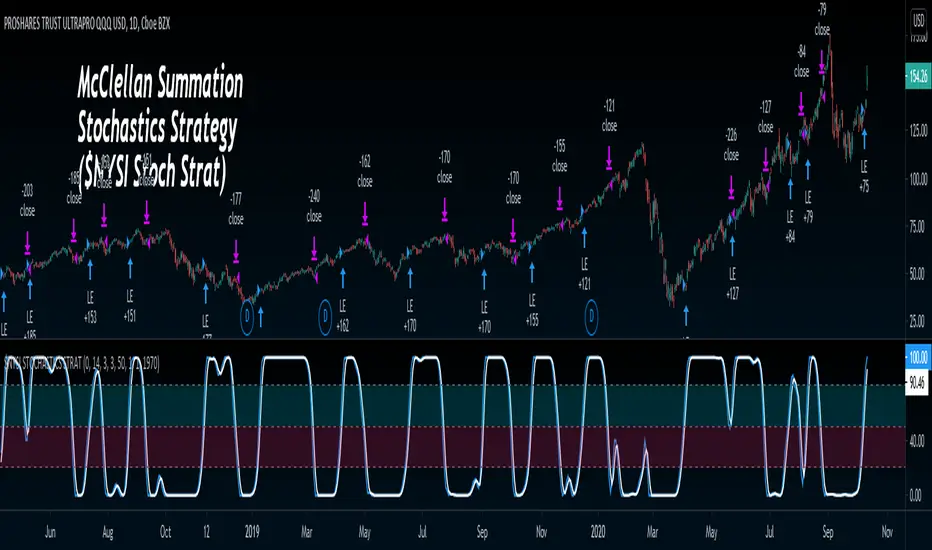
This strategy uses NYSE McClellan summation Index as an input for Stochastics to produce Buy/Sell signals. Buy signal is produced when Stochastics K Line Closes over 50, and Sell signal when closes under 50.
Info on McClellan Summation Index: investopedia.com/terms/m/mcclellansummation.asp
Info on Stochastics: investopedia.com/articles/technical/073001.asp
Simple yet effective strategy, let me know if you have any questions!
Info on McClellan Summation Index: investopedia.com/terms/m/mcclellansummation.asp
Info on Stochastics: investopedia.com/articles/technical/073001.asp
Simple yet effective strategy, let me know if you have any questions!
เอกสารเผยแพร่
I've added two things in this update. 1. Time stamp so you can now back-test from a different start date... for example, since 2019, the strategy is 90% profitable on $TQQQ.
2. I added the ability to change the threshold on Buy/Sell crossover level.
สคริปต์โอเพนซอร์ซ
ด้วยเจตนารมณ์หลักของ TradingView ผู้สร้างสคริปต์นี้ได้ทำให้เป็นโอเพนซอร์ส เพื่อให้เทรดเดอร์สามารถตรวจสอบและยืนยันฟังก์ชันการทำงานของมันได้ ขอชื่นชมผู้เขียน! แม้ว่าคุณจะใช้งานได้ฟรี แต่โปรดจำไว้ว่าการเผยแพร่โค้ดซ้ำจะต้องเป็นไปตาม กฎระเบียบการใช้งาน ของเรา
คำจำกัดสิทธิ์ความรับผิดชอบ
ข้อมูลและบทความไม่ได้มีวัตถุประสงค์เพื่อก่อให้เกิดกิจกรรมทางการเงิน, การลงทุน, การซื้อขาย, ข้อเสนอแนะ หรือคำแนะนำประเภทอื่น ๆ ที่ให้หรือรับรองโดย TradingView อ่านเพิ่มเติมใน ข้อกำหนดการใช้งาน