PROTECTED SOURCE SCRIPT
Intraday VWAP weighted averaged KAMA Bands
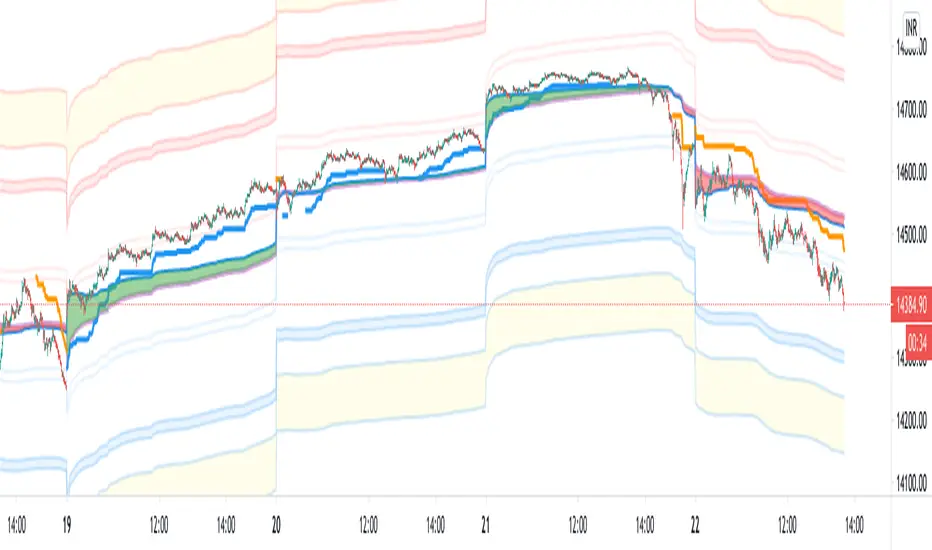
For Intraday trading!
This indicator helps in figuring out the directivity as well as optimum entry criteria in an Intraday Trade
Most of the times in market,
it makes a good sense for any trader to have a particular bias, the indicator helps provide biases with the potential target bands
Explore it and come up with your own explanation! The indicator is self intuitive
Buy when Blue price tracker line appears
Sell when Orange price tracker line appears
Target the just next band line! or Pivot
Which timeframes it works best ?
It is designed for 1 minute
Protected script
This script is published as closed-source. However, you can use it freely and without any limitations – learn more here.
Get Ocs Ai Trader, Your personal Ai Trade Assistant here
→ ocstrader.com
About me
AlgoTrading Certification, ( University of Oxford, Säid Business School )
PGP Research Analysis, ( NISM, SEBI )
Electronics Engineer
→ ocstrader.com
About me
AlgoTrading Certification, ( University of Oxford, Säid Business School )
PGP Research Analysis, ( NISM, SEBI )
Electronics Engineer
Disclaimer
The information and publications are not meant to be, and do not constitute, financial, investment, trading, or other types of advice or recommendations supplied or endorsed by TradingView. Read more in the Terms of Use.