OPEN-SOURCE SCRIPT
ที่อัปเดต: Price Data Label
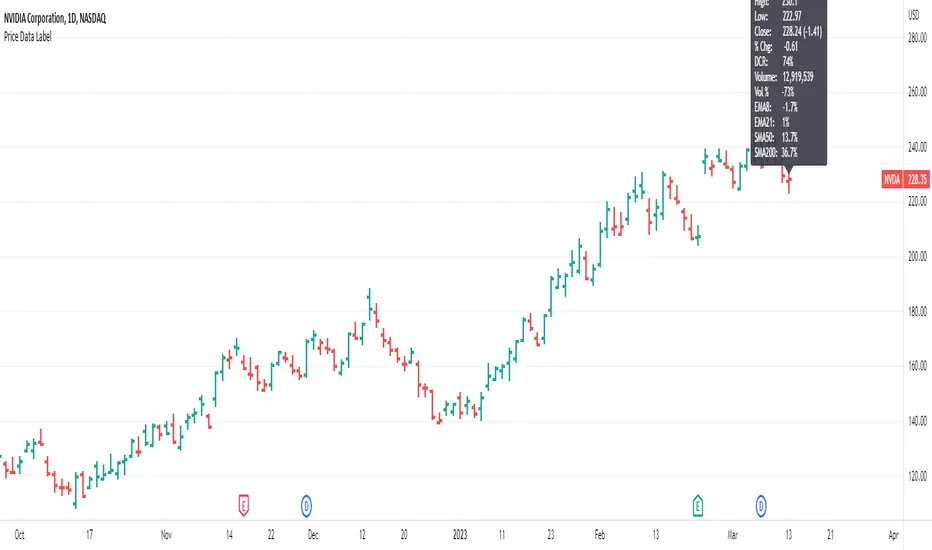
This indicator gives you the ability to see historical data for each bar on the chart by simply hovering over the high of the bar, similar to the functionality of MarketSmith.
Data for each bar includes:
Example of stats on a historical bar:

* Note this only works on the last 500 historical bars. If you use bar replay it will work with 500 historical bars from the last bar.
* If you have multiple indicators on your chart, in order to see the data you will need to use visual order to bring to front. This can be done by clicking the three dots next to the indicator name and selecting visual order.

Data for each bar includes:
- Open
- High
- Low
- Close + Change
- Percentage Change
- Closing Range
- Volume
- Volume Percent based on 50 day average
- Distance to 4 selectable moving averages
Example of stats on a historical bar:
* Note this only works on the last 500 historical bars. If you use bar replay it will work with 500 historical bars from the last bar.
* If you have multiple indicators on your chart, in order to see the data you will need to use visual order to bring to front. This can be done by clicking the three dots next to the indicator name and selecting visual order.
เอกสารเผยแพร่
Turned off the label always showing that was needed for picture. เอกสารเผยแพร่
Added moving average values to the labelเอกสารเผยแพร่
Update to show index volume for the Nasdaq and SPX as well as calculate the index volume percent change vs 50 day average volume. เอกสารเผยแพร่
Update now allows for selectable weekly moving averages. The label will automatically adjust to the user selected weekly moving averages when looking at a weekly chart. เอกสารเผยแพร่
Volume % calculation is now based on the run rate to show the projected volume finish compared to the average volume. เอกสารเผยแพร่
Added a new required parameter to the time format function in the code.เอกสารเผยแพร่
option to view % as ATRสคริปต์โอเพนซอร์ซ
ด้วยเจตนารมณ์หลักของ TradingView ผู้สร้างสคริปต์นี้ได้ทำให้เป็นโอเพนซอร์ส เพื่อให้เทรดเดอร์สามารถตรวจสอบและยืนยันฟังก์ชันการทำงานของมันได้ ขอชื่นชมผู้เขียน! แม้ว่าคุณจะใช้งานได้ฟรี แต่โปรดจำไว้ว่าการเผยแพร่โค้ดซ้ำจะต้องเป็นไปตาม กฎระเบียบการใช้งาน ของเรา
Trusted Pine programmer. Send me a message for script development.
คำจำกัดสิทธิ์ความรับผิดชอบ
ข้อมูลและบทความไม่ได้มีวัตถุประสงค์เพื่อก่อให้เกิดกิจกรรมทางการเงิน, การลงทุน, การซื้อขาย, ข้อเสนอแนะ หรือคำแนะนำประเภทอื่น ๆ ที่ให้หรือรับรองโดย TradingView อ่านเพิ่มเติมใน ข้อกำหนดการใช้งาน
สคริปต์โอเพนซอร์ซ
ด้วยเจตนารมณ์หลักของ TradingView ผู้สร้างสคริปต์นี้ได้ทำให้เป็นโอเพนซอร์ส เพื่อให้เทรดเดอร์สามารถตรวจสอบและยืนยันฟังก์ชันการทำงานของมันได้ ขอชื่นชมผู้เขียน! แม้ว่าคุณจะใช้งานได้ฟรี แต่โปรดจำไว้ว่าการเผยแพร่โค้ดซ้ำจะต้องเป็นไปตาม กฎระเบียบการใช้งาน ของเรา
Trusted Pine programmer. Send me a message for script development.
คำจำกัดสิทธิ์ความรับผิดชอบ
ข้อมูลและบทความไม่ได้มีวัตถุประสงค์เพื่อก่อให้เกิดกิจกรรมทางการเงิน, การลงทุน, การซื้อขาย, ข้อเสนอแนะ หรือคำแนะนำประเภทอื่น ๆ ที่ให้หรือรับรองโดย TradingView อ่านเพิ่มเติมใน ข้อกำหนดการใช้งาน