OPEN-SOURCE SCRIPT
Aether Market Map
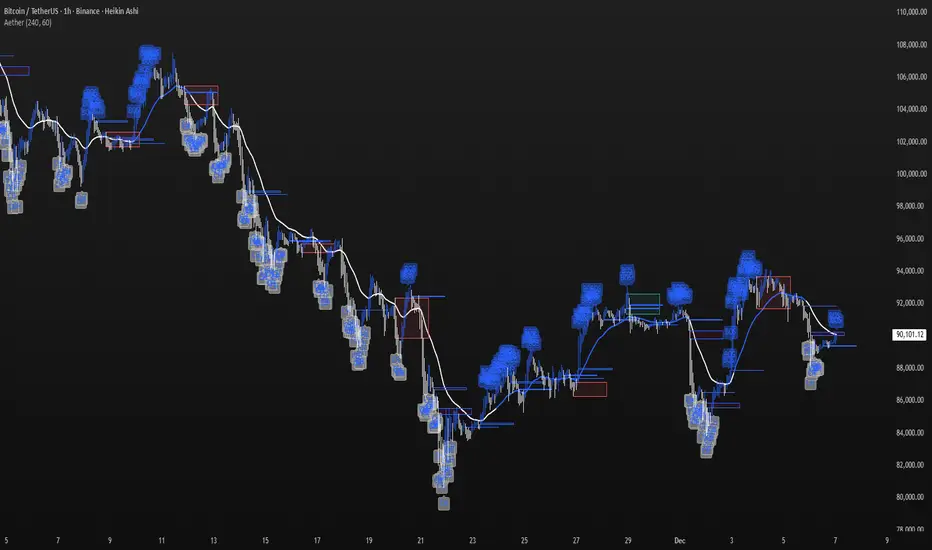
Aether Market Map A multi-component structure-based tool that aids chart analysis by visually displaying various market structure elements.
It combines order blocks, fair value gaps, liquidity segments, trend-shifting signals, and more to help users interpret the pricing structure more clearly.
This script does not provide specific trading strategies or investment advice and is a reference tool for chart analysis.
🔍 Key Features
1. Order Blocks (OB)
Displays the potential inflection sections in box form according to the specified conditions.
This feature helps to visually grasp the price segments that market participants have repeatedly responded to.
2. Fair Value Gaps (FVG)
It detects the area where the imbalance between the candles has occurred and displays it in a box form.
The area represents the section where there has been a fast movement or abnormal flow of prices.
3. Liquidity Levels
Shapes the points where liquidity was gathered through a short-term high-point and low-point pivot structure.
You can see the structural levels at which prices can react repeatedly.
4. BOS / CHOCH (Structural Change Detection)
Label changes in market structure based on recent high/low breakthroughs.
This is not just trend tracking, it helps us to visually grasp the changes in the structure itself.
📈 Analysis of multi-time frame trends
We compute the comprehensive trend state by leveraging the moving average slope of the swing and macro higher order time frames.
These values are reflected in chart background and EMA color changes to intuitively display the overall market mood.
Positive Environment (Regime > 0) → Green Family
Negative Environment (Regime < 0) → Red Series
This is a simple visualization of the flow of the market to the user, not a specific trading direction.
🔧 Signal Engine (Confluence-Based Visual Tool)
The script does not provide a transaction signal and does not induce a particular trading decision.
The Signal feature is a visual notification element that appears on the chart when a number of conditions overlap.
a change in the ratio of trading volume
Structural activities in recent analysis sections
Trending Environment
short-term momentum change
This feature is a reference visual element for interpreting market data from multiple perspectives.
🎛 Setting Items
Show Order Blocks — Visualize Order Blocks
Show Fair Value Gaps — Show FVG Detection
Show Liquidity Levels — Show pivot-based liquidity areas
Show BOS/CHoCH — Show Structural Switching Points
Show Trade Signals — Display visual signal notifications
HTF Settings — Enter parent timeframe analysis values
💡 Precautions for Use
This script is a market structure visualization tool and does not guarantee specific trading strategies, forecasts, or returns.
Components are calculated based on historical data and may not fully reflect real-time market changes.
All features are intended for research and chart analysis assistance purposes.
📌 Official Disclaimer
This script does not provide investment, finance, or trading advice.
All trading judgments made by the user and their consequences are the user's own responsibility.
This tool only provides a reference visualization function to assist with analysis.
สคริปต์โอเพนซอร์ซ
ด้วยเจตนารมณ์หลักของ TradingView ผู้สร้างสคริปต์นี้ได้ทำให้เป็นโอเพนซอร์ส เพื่อให้เทรดเดอร์สามารถตรวจสอบและยืนยันฟังก์ชันการทำงานของมันได้ ขอชื่นชมผู้เขียน! แม้ว่าคุณจะใช้งานได้ฟรี แต่โปรดจำไว้ว่าการเผยแพร่โค้ดซ้ำจะต้องเป็นไปตาม กฎระเบียบการใช้งาน ของเรา
คำจำกัดสิทธิ์ความรับผิดชอบ
ข้อมูลและบทความไม่ได้มีวัตถุประสงค์เพื่อก่อให้เกิดกิจกรรมทางการเงิน, การลงทุน, การซื้อขาย, ข้อเสนอแนะ หรือคำแนะนำประเภทอื่น ๆ ที่ให้หรือรับรองโดย TradingView อ่านเพิ่มเติมใน ข้อกำหนดการใช้งาน