OPEN-SOURCE SCRIPT
Solana – Daily Chart Analysis
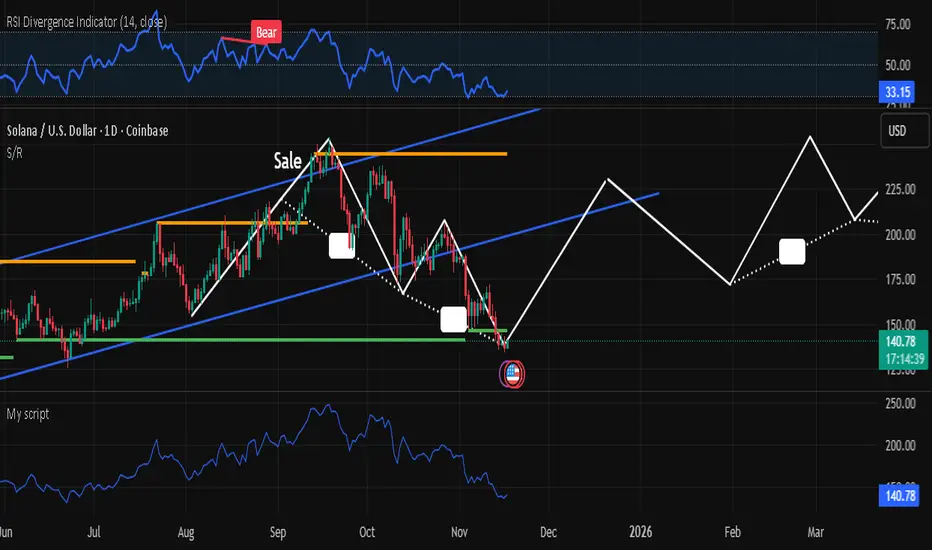
Solana is currently holding around $140 after a sharp correction from the upper channel resistance. Price is testing a key ascending trendline and horizontal support zone near $135.
📉 RSI at 32.76 signals oversold conditions, watch for potential bullish reversal setups.
🔮 Possible Path Ahead (White Projection):
• Bounce to $180 → Consolidation
• Breakout toward $240
• Target zone: $280–$300 by mid-2026
(based on channel re-entry and momentum recovery)
❗If support fails, next major demand zone sits around $100–$110.
📊 Watching closely for confirmation of trend reversal.
สคริปต์โอเพนซอร์ซ
ด้วยเจตนารมณ์หลักของ TradingView ผู้สร้างสคริปต์นี้ได้ทำให้เป็นโอเพนซอร์ส เพื่อให้เทรดเดอร์สามารถตรวจสอบและยืนยันฟังก์ชันการทำงานของมันได้ ขอชื่นชมผู้เขียน! แม้ว่าคุณจะใช้งานได้ฟรี แต่โปรดจำไว้ว่าการเผยแพร่โค้ดซ้ำจะต้องเป็นไปตาม กฎระเบียบการใช้งาน ของเรา
คำจำกัดสิทธิ์ความรับผิดชอบ
ข้อมูลและบทความไม่ได้มีวัตถุประสงค์เพื่อก่อให้เกิดกิจกรรมทางการเงิน, การลงทุน, การซื้อขาย, ข้อเสนอแนะ หรือคำแนะนำประเภทอื่น ๆ ที่ให้หรือรับรองโดย TradingView อ่านเพิ่มเติมใน ข้อกำหนดการใช้งาน