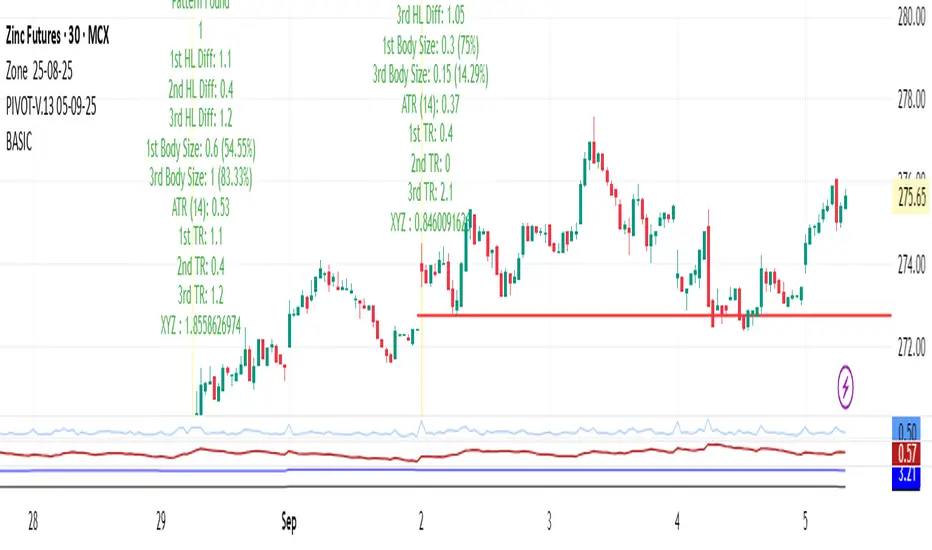
BASIC
---
📊 1. Continuation Patterns
👉 These suggest that the current trend (uptrend or downtrend) will likely continue.
🔹 Flag
Bull Flag → Appears in an uptrend. Sharp upward move (flagpole) followed by a small downward/sideways channel (the flag).
Bear Flag → Opposite, in a downtrend.
📌 Meaning: After the flag consolidation, price usually continues in the original direction.
---
🔹 Pennant
Small symmetrical triangle after a strong move.
Shows temporary pause before trend continuation.
📌 Meaning: Breakout usually follows in the direction of the main trend.
---
🔹 Rectangle
Price moves between parallel support & resistance levels.
Breakout usually happens in the direction of the prevailing trend.
---
📊 2. Reversal Patterns
👉 These suggest that the current trend may reverse direction.
🔹 Head & Shoulders
Looks like a head with two shoulders.
Head & Shoulders Top → Reversal from uptrend to downtrend.
Inverse Head & Shoulders → Reversal from downtrend to uptrend.
📌 Key Level: The “neckline” → breakout confirms reversal.
---
🔹 Double Top & Double Bottom
Double Top → Price tests resistance twice but fails, bearish reversal.
Double Bottom → Price tests support twice but fails, bullish reversal.
---
🔹 Triple Top & Triple Bottom
Same as double but with three tests. Stronger reversal signal.
---
🔹 Rounding Bottom (Saucer)
Price gradually shifts from downtrend to uptrend, looks like a "U" shape.
Very reliable for long-term reversals.
---
📊 3. Neutral / Indecision Patterns
👉 These show uncertainty – direction is confirmed only after breakout.
🔹 Symmetrical Triangle
Price makes lower highs & higher lows (converging).
Breakout can happen either side.
🔹 Ascending Triangle
Flat resistance at top, higher lows forming.
Usually bullish breakout.
🔹 Descending Triangle
Flat support at bottom, lower highs forming.
Usually bearish breakout.
---
✅ Summary for traders:
Continuation = Flag, Pennant, Rectangle.
Reversal = Head & Shoulders, Double/Triple Tops & Bottoms, Rounding Bottom.
Neutral/Indecision = Triangles.
---
Would you like me to make a visual chart image with all these patterns drawn, so you can see how they look on real candlesticks?
สคริปต์แบบเฉพาะผู้ได้รับเชิญเท่านั้น
เฉพาะผู้ใช้ที่ได้รับการอนุมัติจากผู้เขียนเท่านั้นที่สามารถเข้าถึงสคริปต์นี้ได้ คุณจะต้องร้องขอและได้รับอนุญาตก่อนจึงจะสามารถใช้งานได้ โดยปกติจะได้รับอนุญาตหลังจากชำระเงินแล้ว สำหรับรายละเอียดเพิ่มเติม ทำตามคำแนะนำของผู้เขียนด้านล่างหรือติดต่อ jatingajjar75 โดยตรง
TradingView ไม่แนะนำให้ชำระเงินหรือใช้สคริปต์ เว้นแต่ว่าคุณจะเชื่อถือผู้เขียนสคริปต์และเข้าใจวิธีการทำงานของมัน คุณยังอาจพบทางเลือกของโอเพนซอร์ส แบบฟรีในสคริปต์ชุมชนของเรา
คำแนะนำของผู้เขียน
คำจำกัดสิทธิ์ความรับผิดชอบ
สคริปต์แบบเฉพาะผู้ได้รับเชิญเท่านั้น
เฉพาะผู้ใช้ที่ได้รับการอนุมัติจากผู้เขียนเท่านั้นที่สามารถเข้าถึงสคริปต์นี้ได้ คุณจะต้องร้องขอและได้รับอนุญาตก่อนจึงจะสามารถใช้งานได้ โดยปกติจะได้รับอนุญาตหลังจากชำระเงินแล้ว สำหรับรายละเอียดเพิ่มเติม ทำตามคำแนะนำของผู้เขียนด้านล่างหรือติดต่อ jatingajjar75 โดยตรง
TradingView ไม่แนะนำให้ชำระเงินหรือใช้สคริปต์ เว้นแต่ว่าคุณจะเชื่อถือผู้เขียนสคริปต์และเข้าใจวิธีการทำงานของมัน คุณยังอาจพบทางเลือกของโอเพนซอร์ส แบบฟรีในสคริปต์ชุมชนของเรา