ZenAlgo - Waves
Purpose and Justification for Integration
ZenAlgo - Waves strategically integrates multiple methodologies to provide trend validation. This indicator goes beyond standalone calculations by layering:
- Original Wave Oscillator: Used to detect market momentum shifts and overbought/oversold conditions, further filtered by additional trend confirmation layers.
- RSI + MFI Fusion: Introduces price-volume relationship validation, reducing misleading momentum reading.
- Dynamic Extra Moving Average (MA): Acts as an adaptive trend filter, ensuring signals align with prevailing market direction rather than reacting to noise.
- Divergence Detection: Contextualized divergence detection for both Wave and RSI+MFI.
- Multi-Timeframe Trend Table: Facilitates confirmation across different timeframes, helping traders validate trade setups.
Attribution & Originality
ZenAlgo - Waves is an independently developed indicator that builds upon well-known technical analysis techniques while introducing significant enhancements. Unlike traditional WaveTrend indicator, it replaces the fixed constants of the original WaveTrend approach with a dynamic formula based on standard deviation, allowing for more adaptive and responsive calculations.
Additionally, this script integrates Ehlers' Super Smoother Filter, a highly regarded smoothing technique pioneered by John F. Ehlers and freely available for public use. Beyond these foundations, ZenAlgo - Waves incorporates proprietary logic and unique enhancements, setting it apart from conventional alternatives.
If you're seeking an exact replication of WaveTrend, please note that this indicator follows a distinct methodology, producing different calculations and outputs.
How to Use
- Identify Key Zones: Observe Wave oscillator values to detect potential overbought and oversold conditions, which may vary based on settings.
- Check RSI+MFI Histogram: Confirm momentum strength—bullish (increasing green bars) or bearish (increasing red bars).
- Assess Trend via Extra MA: Use the Extra Moving Average to determine overall trend direction.
- Look for Divergences: Identify divergences between price action and Wave/RSI+MFI for potential reversals.
- Monitor Multi-Timeframe Trend Table: Check for alignment across timeframes for additional confirmation.
- Set Alerts for Key Conditions: Configure alerts for Wave crossovers, divergences, and Extra MA state changes.
- Analyze Conditions Before Making Decisions: The indicator does not execute trades. Traders should use it as a confirmation tool alongside a broader strategy.
Detailed Explanation of Calculation Logic
ZenAlgo - Waves builds on established wave-based oscillator principles, fine-tuning them for greater adaptability:
- Baseline & Difference: Computes a smoothed average of the price source (e.g., HLC3) and measures the difference (or "deviation") between the current price and this baseline.
- Volatility Scaling: Uses standard deviation to capture market volatility instead of relying on a static multiplier.
- Normalization & Smoothing: Processes the resulting ratio into an oscillator, helping identify overbought and oversold zones. Optionally applies a secondary smoothing pass (including Ehlers' Super Smoother - SMMA) to reduce noise while preserving trend structure.
- RSI + MFI Integration: Fuses RSI and MFI into a single composite metric, weighting RSI momentum with volume-adjusted MFI values for a clearer representation of momentum strength.
- Extra Moving Average Filtering: A variety of moving average types (EMA, Hull, ZEMA, etc.) smooth the underlying trend, with sensitivity to trend changes customizable.
- Divergence Detection: Identifies both regular and hidden divergences by comparing oscillator movements against price action, adjusting dynamically based on historical volatility.
- Multi-Timeframe Trend Confirmation: Aggregates data across multiple timeframes (e.g., 1m, 5m, 15m, 1h) to provide a broader market context.
- Alerts and Key Conditions: Alerts can be configured for specific conditions such as Wave crossovers, RSI+MFI confirmation, or Extra MA transitions. These alerts serve as notifications, not as automatic trading signals.
Why It’s Worth Paying For
ZenAlgo - Waves differentiates itself from free indicators by providing:
- Contextual Signal Filtering: Integrates price-volume analysis and trend alignment checks.
- Adaptive Trend Classification: Dynamically adjusts to market conditions.
- Multi-Layer Confirmation: Requires momentum, volume, and trend agreement before providing insights.
- Advanced Divergence Detection: Filters out noise-based divergences, highlighting only significant price-action-driven reversals.
- Multi-Timeframe Validation: Helps ensure that observed trends are consistent across different timeframes.
Considerations for Use:
- During periods of low trading volume, as price action lacks conviction.
- In highly volatile market conditions, rapid price swings can introduce uncertainty.
- Fundamental news events can override technical patterns.
- If trends contradict across multiple timeframes, additional confirmation is recommended before making decisions.
Important Notes
- This indicator is a tool for technical analysis and does not guarantee trading success.
- Best Practices: Use ZenAlgo - Waves in conjunction with other indicators and fundamental analysis for a well-rounded approach.
ZenAlgo - Waves is a tool that combines multiple methodologies to analyze market fluctuations and price behavior. Each component contributes to a structured approach by refining how price movements are interpreted in different contexts.
- Wave Oscillator: This oscillator measures the extent to which price deviates from a dynamically adjusted baseline, which is calculated using a smoothed moving average of price levels. The deviation is then scaled based on recent market volatility using a standard deviation factor. This approach allows the oscillator to expand its range during high-volatility periods and contract when volatility is low, making it more adaptive compared to fixed-threshold oscillators. The result is a momentum measure that adjusts dynamically rather than responding to absolute price differences alone.
- RSI+MFI Combination: This component merges the Relative Strength Index (RSI) and Money Flow Index (MFI) into a single calculation, aiming to provide additional context regarding price movement. RSI measures momentum based on closing price changes over a given period, whereas MFI incorporates both price and volume by assessing how capital is distributed within each price movement. By combining these two metrics, the calculation assigns greater weight to price shifts that occur with significant volume, while reducing the emphasis on those occurring with minimal volume. This distinction helps differentiate between movements driven by strong participation and those occurring in lower liquidity conditions.
- Extra Moving Average (MA): This component applies an additional smoothing layer to price-derived calculations. Unlike traditional moving averages that only smooth price directly, this moving average is applied to the Wave Oscillator’s output. This allows it to act as a trend filter that emphasizes sustained directional movement while suppressing fluctuations that may be short-term noise. Several types of moving averages, including EMA, WMA, and Hull MA, can be selected based on how much smoothing or responsiveness is preferred. By applying this filter, the tool provides an adjusted version of the oscillator that reflects broader price tendencies while retaining sensitivity to shifts in momentum.
- Divergence Detection: This component identifies instances where the price movement and oscillator behavior diverge. A divergence occurs when price reaches a new high or low that is not reflected in the corresponding oscillator calculation. This discrepancy suggests that the oscillator's momentum characteristics differ from the direct price trend. The tool applies this detection to both the Wave Oscillator and the RSI+MFI calculation, ensuring that both a price-relative and volume-adjusted perspective are considered. Divergences can be categorized based on whether the oscillator moves in alignment with historical price swings or behaves in a manner inconsistent with past price trends.
- Multi-Timeframe Trend Table: This table aggregates the calculated values from multiple timeframes, displaying how the different components behave across varying levels of market granularity. Instead of evaluating trends in isolation, this feature allows users to compare calculations from short-term (e.g., 1-minute) and long-term (e.g., daily) charts side by side. This enables the assessment of whether a momentum shift is occurring within a localized timeframe or is part of a broader movement that aligns across multiple timeframes.
Each component in this tool operates as part of a combined framework, where calculations interact rather than being presented in isolation. The integration of multiple approaches enables the identification of conditions where multiple independent methods align, reinforcing the overall assessment of market behavior.
- The moving average period for RSI has been adjusted from 25 to 3 candles.
- This makes the displayed RSI trend more reactive to recent price movements, reducing lag in visualization.
Wave Line Modification
- The Wave line, previously a single line, has been replaced with a two-line band to represent rising or falling direction.
- This enhances visualization by showing variability within the wave movement rather than a singular trajectory.
- Color Adjustment: white when increasing (indicating an upward movement) and gold when falling (indicating a downward movement).
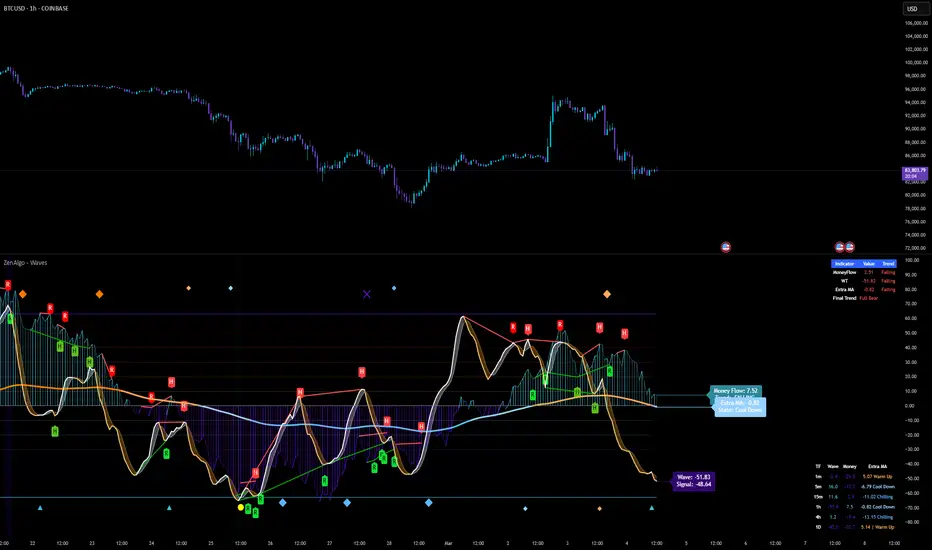
New Indicator Table
New indicator table shows recent value of selected indicators alongside with trend column. The trend column displays whether each respective indicator is rising or falling.
The table includes:
- Money Flow – Reflecting liquidity and volume influence.
- Wave Trend (WT) – Capturing short-term price movement characteristics.
- Extra Moving Average (Extra MA) – Analyzing longer-term trend conditions.
- Final Trend – Summarizing multiple components into a comprehensive trend indicator.
Refinements to Extra MA Display
The Extra MA label now dynamically reflects its classification into one of the following predefined states:
- NO BRAIN SHORT (above 40)
- FIRE (Sell) (above 30)
- Overheated (above 20)
- Heating (above 10)
- Warm Up (above 0)
- Cool Down (above -10)
- Chilling (above -20)
- Freezing (above -30)
- ICE (Buy) (above -40)
- NO BRAIN BUY (below -40)
The color of the Extra MA label now corresponds to these states, making it visually easier to interpret the current condition.
สคริปต์แบบเฉพาะผู้ได้รับเชิญเท่านั้น
เฉพาะผู้ใช้งานที่ผู้เขียนอนุมัตเท่านั้นจึงจะสามารถเข้าถึงสคริปต์นี้ได้ คุณจะต้องขอและได้รับอนุญาตก่อนใช้งาน ซึ่งโดยทั่วไปจะได้รับอนุญาตหลังจากชำระเงินแล้ว สำหรับรายละเอียดเพิ่มเติม โปรดทำตามคำแนะนำของผู้เขียนด้านล่าง หรือติดต่อ ZenAlgo_Official โดยตรง
TradingView ไม่แนะนำให้จ่ายเงินหรือใช้สคริปต์ เว้นแต่คุณจะเชื่อถือผู้เขียนและเข้าใจวิธีการทำงานของสคริปต์นั้นอย่างถ่องแท้ คุณยังสามารถหาทางเลือกแบบโอเพนซอร์สฟรีได้ใน สคริปต์ชุมชนของเรา
คำแนะนำของผู้เขียน
zenalgo.com
discord.zenalgo.com
คำจำกัดสิทธิ์ความรับผิดชอบ
สคริปต์แบบเฉพาะผู้ได้รับเชิญเท่านั้น
เฉพาะผู้ใช้งานที่ผู้เขียนอนุมัตเท่านั้นจึงจะสามารถเข้าถึงสคริปต์นี้ได้ คุณจะต้องขอและได้รับอนุญาตก่อนใช้งาน ซึ่งโดยทั่วไปจะได้รับอนุญาตหลังจากชำระเงินแล้ว สำหรับรายละเอียดเพิ่มเติม โปรดทำตามคำแนะนำของผู้เขียนด้านล่าง หรือติดต่อ ZenAlgo_Official โดยตรง
TradingView ไม่แนะนำให้จ่ายเงินหรือใช้สคริปต์ เว้นแต่คุณจะเชื่อถือผู้เขียนและเข้าใจวิธีการทำงานของสคริปต์นั้นอย่างถ่องแท้ คุณยังสามารถหาทางเลือกแบบโอเพนซอร์สฟรีได้ใน สคริปต์ชุมชนของเรา
คำแนะนำของผู้เขียน
zenalgo.com
discord.zenalgo.com