OPEN-SOURCE SCRIPT
RV Indicator
This Pine Script defines a custom Relative Volatility (RV) Indicator, which measures the ratio of directional price movement to volatility over a specified number of bars. Below is a full explanation of what this script does.
Title:
RV Indicator — Relative Volatility Oscillator
Purpose:
This indicator measures how aggressively price is moving compared to recent volatility, and smooths the result with a signal line. It can be used to gauge momentum shifts and trend strength.
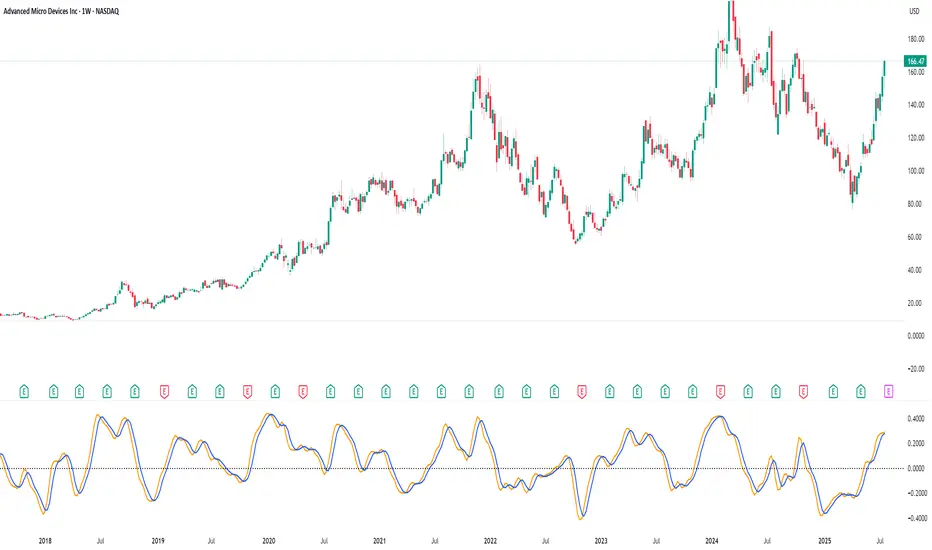
How It Works – Step by Step
1. Measuring Price Momentum (v1)
It calculates the difference between the close and open prices of the last 4 candles.
A weighted average is applied:
The current candle and the one 3 bars ago get weight 1.
The two middle candles (1 and 2 bars ago) get weight 2.
This creates a smoothed momentum measure:
If close > open (bullish), v1 is positive.
If close < open (bearish), v1 is negative.
2. Measuring Volatility (v2)
Similarly, it calculates the high-low range for the last 4 candles.
The same weighting (1, 2, 2, 1) is applied.
This gives a smoothed volatility measure.
3. Combining Momentum and Volatility (RV Ratio)
For the past ti bars (default: 10), it sums up:
All v1 values (momentum sum)
All v2 values (volatility sum)
Then it divides them:
𝑅𝑉= sum of price momentum % sum of volatility
This produces the RV value:
RV > 0: Momentum is bullish (price is generally moving up relative to its volatility).
RV < 0: Momentum is bearish (price is moving down relative to its volatility).
4. Smoothed Signal Line (rvsig)
A smoothed version of the RV is created using a weighted average of the latest 4 RV values.
This acts like a signal line, similar to how MACD uses a signal line.
Crossovers between RV and this signal line can be used to detect shifts in momentum.
5. Visual Output
Orange Line (RV): Shows the raw momentum/volatility ratio.
Blue Line (Signal): A smoother line that follows RV more slowly.
Zero Line: Divides bullish vs. bearish momentum.
How to Use It in Trading
1. Look for Crossovers:
If RV crosses above its signal line → Possible buy signal (momentum turning bullish).
If RV crosses below its signal line → Possible sell signal (momentum turning bearish).
2. Check the Zero Line:
If both RV and Signal are above zero, momentum is bullish.
If both are below zero, momentum is bearish.
3. Filter False Signals:
Combine RV with a trend filter (like a 50 or 200 EMA) to avoid trading against the main trend.
Disclaimer: This script is for informational and educational purposes only. It does not constitute financial advice or a recommendation to buy or sell any asset. All trading decisions are solely your responsibility. Use at your own risk.
Title:
RV Indicator — Relative Volatility Oscillator
Purpose:
This indicator measures how aggressively price is moving compared to recent volatility, and smooths the result with a signal line. It can be used to gauge momentum shifts and trend strength.
How It Works – Step by Step
1. Measuring Price Momentum (v1)
It calculates the difference between the close and open prices of the last 4 candles.
A weighted average is applied:
The current candle and the one 3 bars ago get weight 1.
The two middle candles (1 and 2 bars ago) get weight 2.
This creates a smoothed momentum measure:
If close > open (bullish), v1 is positive.
If close < open (bearish), v1 is negative.
2. Measuring Volatility (v2)
Similarly, it calculates the high-low range for the last 4 candles.
The same weighting (1, 2, 2, 1) is applied.
This gives a smoothed volatility measure.
3. Combining Momentum and Volatility (RV Ratio)
For the past ti bars (default: 10), it sums up:
All v1 values (momentum sum)
All v2 values (volatility sum)
Then it divides them:
𝑅𝑉= sum of price momentum % sum of volatility
This produces the RV value:
RV > 0: Momentum is bullish (price is generally moving up relative to its volatility).
RV < 0: Momentum is bearish (price is moving down relative to its volatility).
4. Smoothed Signal Line (rvsig)
A smoothed version of the RV is created using a weighted average of the latest 4 RV values.
This acts like a signal line, similar to how MACD uses a signal line.
Crossovers between RV and this signal line can be used to detect shifts in momentum.
5. Visual Output
Orange Line (RV): Shows the raw momentum/volatility ratio.
Blue Line (Signal): A smoother line that follows RV more slowly.
Zero Line: Divides bullish vs. bearish momentum.
How to Use It in Trading
1. Look for Crossovers:
If RV crosses above its signal line → Possible buy signal (momentum turning bullish).
If RV crosses below its signal line → Possible sell signal (momentum turning bearish).
2. Check the Zero Line:
If both RV and Signal are above zero, momentum is bullish.
If both are below zero, momentum is bearish.
3. Filter False Signals:
Combine RV with a trend filter (like a 50 or 200 EMA) to avoid trading against the main trend.
Disclaimer: This script is for informational and educational purposes only. It does not constitute financial advice or a recommendation to buy or sell any asset. All trading decisions are solely your responsibility. Use at your own risk.
สคริปต์โอเพนซอร์ซ
ด้วยเจตนารมณ์หลักของ TradingView ผู้สร้างสคริปต์นี้ได้ทำให้เป็นโอเพนซอร์ส เพื่อให้เทรดเดอร์สามารถตรวจสอบและยืนยันฟังก์ชันการทำงานของมันได้ ขอชื่นชมผู้เขียน! แม้ว่าคุณจะใช้งานได้ฟรี แต่โปรดจำไว้ว่าการเผยแพร่โค้ดซ้ำจะต้องเป็นไปตาม กฎระเบียบการใช้งาน ของเรา
คำจำกัดสิทธิ์ความรับผิดชอบ
ข้อมูลและบทความไม่ได้มีวัตถุประสงค์เพื่อก่อให้เกิดกิจกรรมทางการเงิน, การลงทุน, การซื้อขาย, ข้อเสนอแนะ หรือคำแนะนำประเภทอื่น ๆ ที่ให้หรือรับรองโดย TradingView อ่านเพิ่มเติมใน ข้อกำหนดการใช้งาน