OPEN-SOURCE SCRIPT
Daily Candle Box

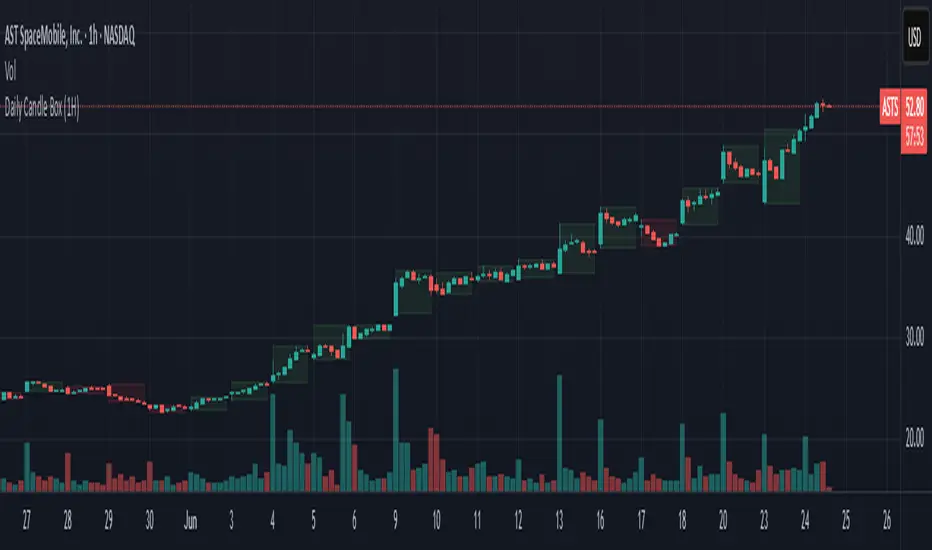
Daily candle overlay, high, low, and candle color based on open and close
Charts included in script: '3m', '5m', '15m', '1H'
1. Visualizes Key Daily Levels on Lower Timeframes:
The indicator overlays the previous day’s high and low as a box on a lower timeframe chart (e.g., 5-minute). This highlights critical support and resistance levels from the daily timeframe, making it easier to see where price might react without switching to a daily chart.
Use Case: Traders can identify potential reversal or breakout zones on intraday charts, aligning lower timeframe trades with higher timeframe structure.
2. Simplifies Intraday Trading Decisions:
By showing the previous day’s range (high to low) as a box, it provides a clear context for intraday price action. For example, if the price approaches the box’s top (previous day’s high), traders might anticipate resistance or a breakout.
Use Case: Useful for scalpers or day traders who need to quickly assess whether the price is near significant daily levels for entries, exits, or stop-loss placement.
3. Highlights Daily Candle Direction:
The box’s color (green for bullish, red for bearish) indicates whether the previous day’s close was above or below its open. This provides a quick visual cue about the prior day’s market sentiment.
สคริปต์โอเพนซอร์ซ
ด้วยเจตนารมณ์หลักของ TradingView ผู้สร้างสคริปต์นี้ได้ทำให้เป็นโอเพนซอร์ส เพื่อให้เทรดเดอร์สามารถตรวจสอบและยืนยันฟังก์ชันการทำงานของมันได้ ขอชื่นชมผู้เขียน! แม้ว่าคุณจะใช้งานได้ฟรี แต่โปรดจำไว้ว่าการเผยแพร่โค้ดซ้ำจะต้องเป็นไปตาม กฎระเบียบการใช้งาน ของเรา
คำจำกัดสิทธิ์ความรับผิดชอบ
ข้อมูลและบทความไม่ได้มีวัตถุประสงค์เพื่อก่อให้เกิดกิจกรรมทางการเงิน, การลงทุน, การซื้อขาย, ข้อเสนอแนะ หรือคำแนะนำประเภทอื่น ๆ ที่ให้หรือรับรองโดย TradingView อ่านเพิ่มเติมใน ข้อกำหนดการใช้งาน