OPEN-SOURCE SCRIPT
Awesome Oscillator Twin Peaks Strategy
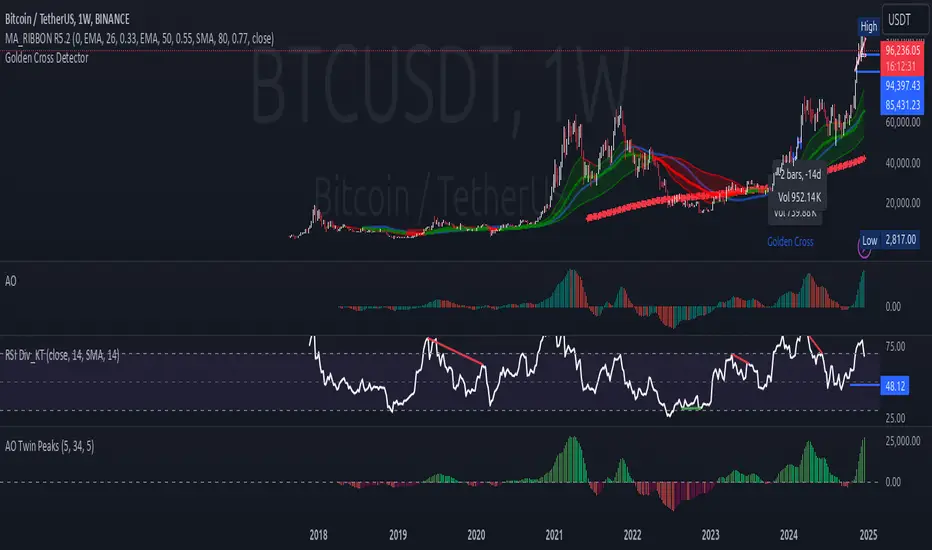
1. The indicator identifies both bullish and bearish twin peaks:
- Bullish: Two consecutive valleys below zero, where the second valley is higher than the first
- Bearish: Two consecutive peaks above zero, where the second peak is lower than the first
2. Visual elements:
- AO histogram with color-coding for increasing/decreasing values
- Triangle markers for confirmed twin peak signals
- Zero line for reference
- Customizable colors through inputs
3. Built-in safeguards:
- Minimum separation between peaks to avoid false signals
- Maximum time window for pattern completion
- Clear signal reset conditions
4. Alert conditions for both bullish and bearish signals
To use this indicator:
1. Add it to your TradingView chart
2. Customize the input parameters if needed
3. Look for triangle markers that indicate confirmed twin peak patterns
4. Optional: Set up alerts based on the signal conditions
สคริปต์โอเพนซอร์ซ
ด้วยเจตนารมณ์หลักของ TradingView ผู้สร้างสคริปต์นี้ได้ทำให้เป็นโอเพนซอร์ส เพื่อให้เทรดเดอร์สามารถตรวจสอบและยืนยันฟังก์ชันการทำงานของมันได้ ขอชื่นชมผู้เขียน! แม้ว่าคุณจะใช้งานได้ฟรี แต่โปรดจำไว้ว่าการเผยแพร่โค้ดซ้ำจะต้องเป็นไปตาม กฎระเบียบการใช้งาน ของเรา
คำจำกัดสิทธิ์ความรับผิดชอบ
ข้อมูลและบทความไม่ได้มีวัตถุประสงค์เพื่อก่อให้เกิดกิจกรรมทางการเงิน, การลงทุน, การซื้อขาย, ข้อเสนอแนะ หรือคำแนะนำประเภทอื่น ๆ ที่ให้หรือรับรองโดย TradingView อ่านเพิ่มเติมใน ข้อกำหนดการใช้งาน