OPEN-SOURCE SCRIPT
Previous Candle Range Split into Thirds
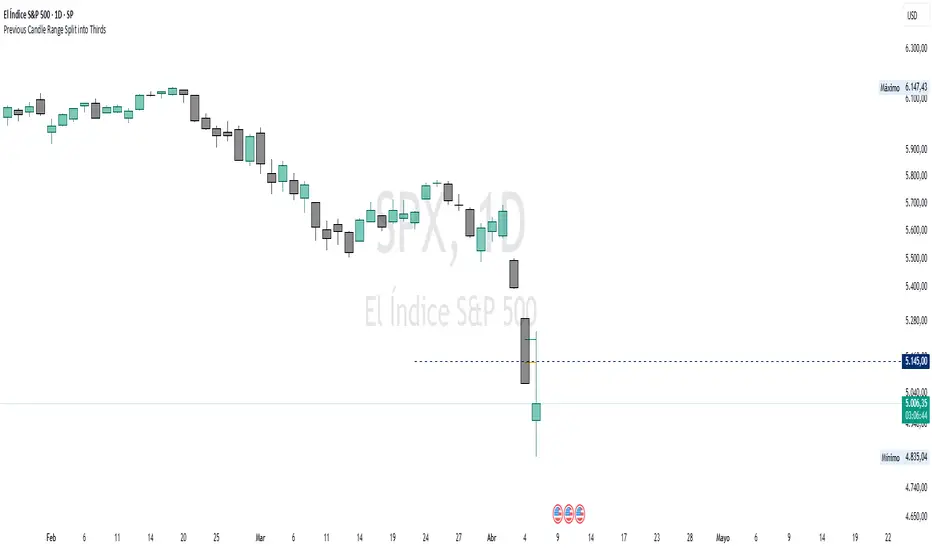
This script plots two horizontal lines over the previous candle to divide its total range (high to low) into three equal parts. The first line marks 33% of the range from the low, and the second marks 66%. This helps users visually identify whether the previous candle closed in the lower, middle, or upper third of its range, providing context on potential buyer or seller dominance during that session.
Users can customize the color, width, and style (solid, dotted, dashed) of each line, as well as toggle their visibility from the script's input settings.
This indicator is designed as a discretionary analysis tool and does not generate buy or sell signals.
Users can customize the color, width, and style (solid, dotted, dashed) of each line, as well as toggle their visibility from the script's input settings.
This indicator is designed as a discretionary analysis tool and does not generate buy or sell signals.
สคริปต์โอเพนซอร์ซ
ด้วยเจตนารมณ์หลักของ TradingView ผู้สร้างสคริปต์นี้ได้ทำให้เป็นโอเพนซอร์ส เพื่อให้เทรดเดอร์สามารถตรวจสอบและยืนยันฟังก์ชันการทำงานของมันได้ ขอชื่นชมผู้เขียน! แม้ว่าคุณจะใช้งานได้ฟรี แต่โปรดจำไว้ว่าการเผยแพร่โค้ดซ้ำจะต้องเป็นไปตาม กฎระเบียบการใช้งาน ของเรา
Setup + Risk Management + 1% better daily = Consistency. 📈
คำจำกัดสิทธิ์ความรับผิดชอบ
ข้อมูลและบทความไม่ได้มีวัตถุประสงค์เพื่อก่อให้เกิดกิจกรรมทางการเงิน, การลงทุน, การซื้อขาย, ข้อเสนอแนะ หรือคำแนะนำประเภทอื่น ๆ ที่ให้หรือรับรองโดย TradingView อ่านเพิ่มเติมใน ข้อกำหนดการใช้งาน